. 2017 Oct 17;47(4):776-788.e5.
doi: 10.1016/j.immuni.2017.09.018.

CTLA-4+PD-1- Memory CD4+ T Cells Critically Contribute to Viral Persistence in Antiretroviral Therapy-Suppressed, SIV-Infected Rhesus Macaques

Affiliations

CTLA-4+PD-1- Memory CD4+ T Cells Critically Contribute to Viral Persistence in Antiretroviral Therapy-Suppressed, SIV-Infected Rhesus Macaques

Colleen S McGary et al. Immunity. .

Abstract

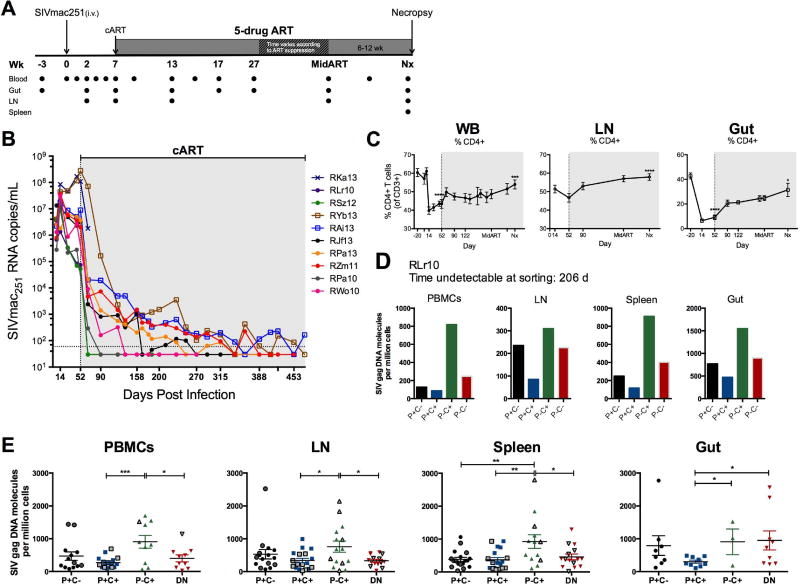
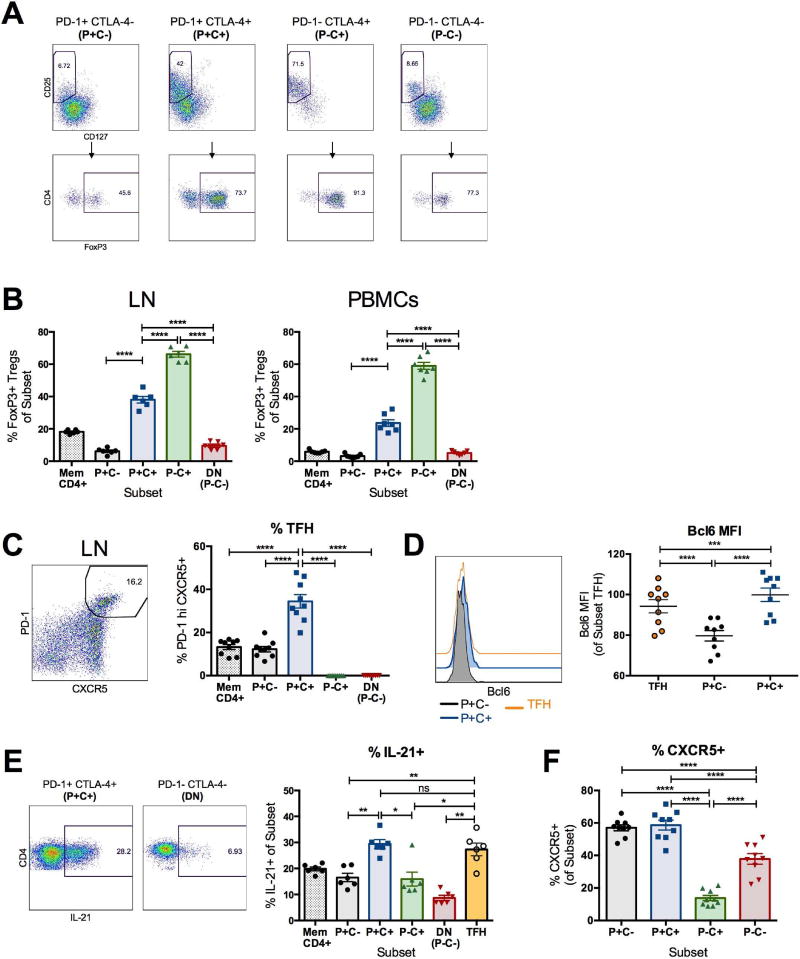
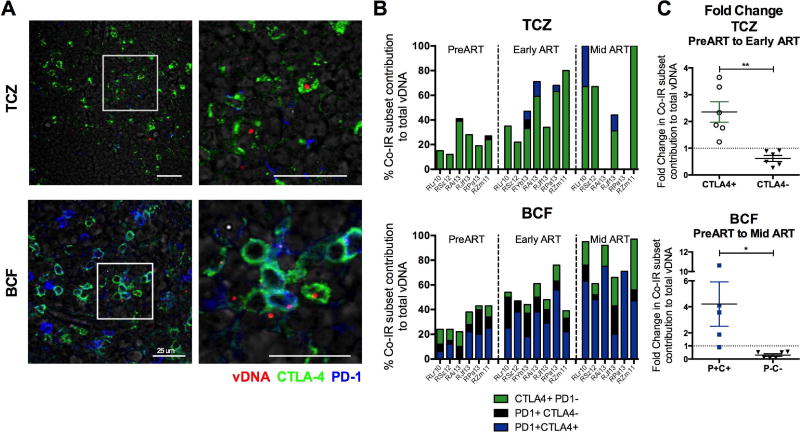
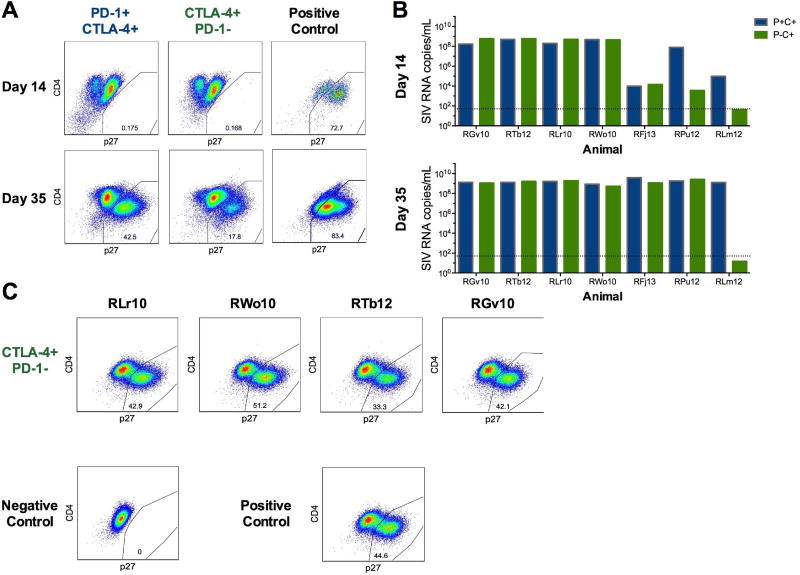
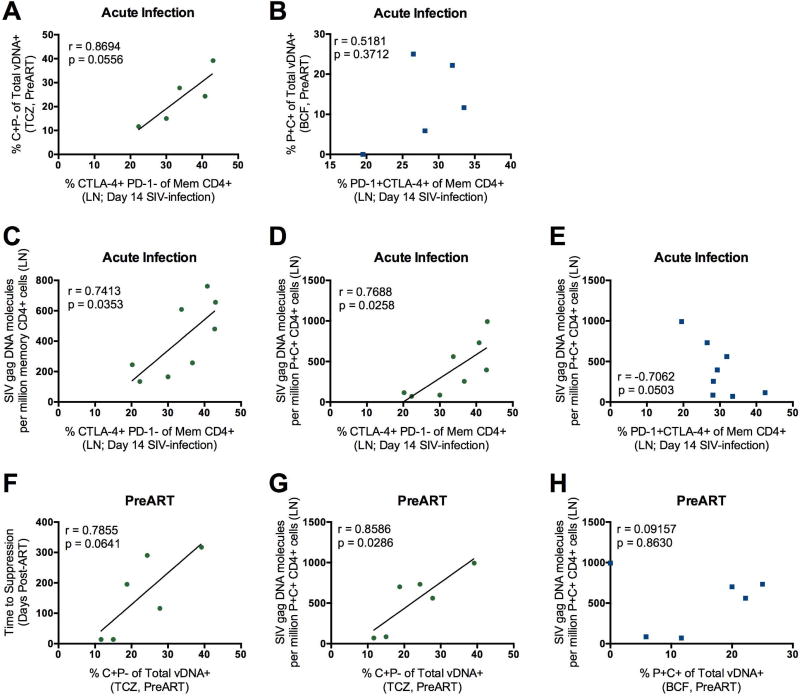
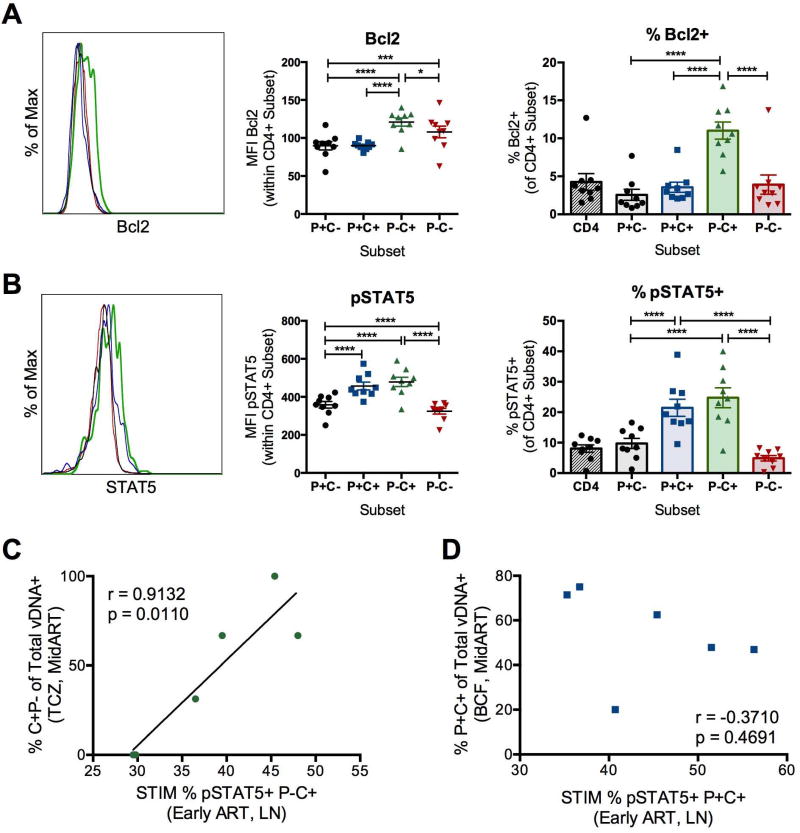
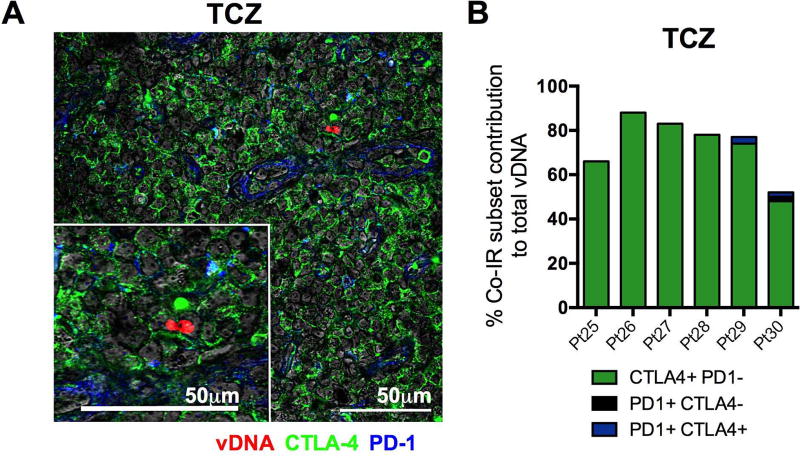
Antiretroviral therapy (ART) suppresses viral replication in HIV-infected individuals but does not eliminate the reservoir of latently infected cells. Recent work identified PD-1+ follicular helper T (Tfh) cells as an important cellular compartment for viral persistence. Here, using ART-treated, SIV-infected rhesus macaques, we show that CTLA-4+PD-1- memory CD4+ T cells, which share phenotypic markers with regulatory T cells, were enriched in SIV DNA in blood, lymph nodes (LN), spleen, and gut, and contained replication-competent and infectious virus. In contrast to PD-1+ Tfh cells, SIV-enriched CTLA-4+PD-1- CD4+ T cells were found outside the B cell follicle of the LN, predicted the size of the persistent viral reservoir during ART, and significantly increased their contribution to the SIV reservoir with prolonged ART-mediated viral suppression. We have shown that CTLA-4+PD-1- memory CD4+ T cells are a previously unrecognized component of the SIV and HIV reservoir that should be therapeutically targeted for a functional HIV-1 cure.

Keywords: CTLA-4; HIV; PD-1; SIV; T follicular helper cells; animal models; co-inhibitory receptors; latent viral reservoir; regulatory T cells.


Conflict of interest statement

The authors have declared that no conflict of interest exists.

Figures

Figure 1
Figure 1. CTLA-4+PD-1 memory CD4+ T cells harbor higher amounts of SIV DNA following ART-mediated, viral load suppression
(A)Study design. Ten RMs were infected i.v. with 1000 TCID50 SIVmac251 (day 0), and at 7 weeks post-infection, initiated ART (PMPA, FTC, raltegravir, and ritonavir-boosted darunavir). All animals were maintained on ART regimen until plasma viremia was undetectable for at least 3 months. Peripheral blood (WB), rectal biopsy (Gut), and lymph node (LN) biopsies were collected at the indicated time points and multiple organs were harvested at elective necropsy. Sorting of memory CD4+ T cells by Co-IR expression was performed at two time points during ART: first, at Mid ART (approximately 1 month following undetectable viremia); and second, at necropsy. (B) Plasma viral loads are shown for the 10 individual RMs, quantified using the standard qRT-PCR assay (limit of detection, LOD, of 60 SIV RNA copies/mL of plasma represented by the horizontal dotted line). Undetectable measurements are plotted as one-half of the LOD (30 copies/mL). (C) Frequencies (of live CD3+ T cells) of CD4+ T cells were longitudinally measured in WB, LN, and gut biopsies. The gray shaded area represents time on ART; Nx represents the measured values from animal necropsy. Repeated-measures analyses were performed using a means model (SAS Mixed Procedure, version 9.4) to determine statistical significance, with indicated tests of significance representing comparison to pre-SIV infection (WB, Gut) or pre-ART initiation (LN). (D) Representative SIV DNA quantities in the PBMCs, LN, spleen, and gut tissues for an individual RM (RLr10) after 206 days of viral load suppression (n=9). (E) Cell-associated SIVGAG DNA was quantified from CTLA-4 and PD-1-sorted subsets of 9 ART-treated, SIV-infected RMs at least three months following the first undetectable viral load (163 ± 42 d). Data from subsets with less than 10,000 sorted cells were excluded when undetectable. Sample averages are indicated by the horizontal bar on each graph (± SEM), and t-tests were used to compare amounts of DNA between subsets (P, PD-1; C, CTLA-4). *, p<0.05; **, p<0.01; ***, p<0.001; ****, p<0.0001. Please also see figure S2.
Figure 2
Figure 2. CTLA-4+PD-1 CD4+ T cells overlap with regulatory T cells
(A) Representative flow plots of regulatory T cells (Treg), defined as CD25+CD127Io and FoxP3+, within CTLA-4 and PD-1-expressing memory CD4+ T cell subsets are shown from the LN of an ART-treated, SIV-infected RM at necropsy. The results shown are from unstimulated lymphocytes, where CTLA-4 expression was measured intracellularly; similar results were obtained following PMA and lonomycin stimulation (not shown). (B) The frequencies of FoxP3+ Treg cells within memory CD4+ T cell subsets are shown from the LN and PBMCs of 6 ART-treated, SIV-infected RMs. (C) Representative flow plot demonstrating the gating for follicular helper cells (Tfh) within the LN of an ART-treated, SIV-infected RM, defined as PD-1hi CXCR5+ cells. Frequencies of Tfh cells were quantified in the LN of 9 ART-treated, SIV-infected RMs in the absence of stimulation at day 90 post-SIV infection (38–41 days on ART). (D) The representative histograms and aggregate mean fluorescence intensity (MFI) of Bcl6 within LN PD-1-expressing memory CD4+ T cell subsets ex vivo are shown at day 90 post-SIV infection (n=9). (E) Representative flow plots of IL-21 production by PD-1+CTLA-4+ and PD-1CTLA-4 (DN) memory CD4+ T cells (n=6). Production of IL-21 by each CTLA-4 and PD-1-expressing subset was measured from the LN of 6 ART-treated, SIV-infected RMs following a 3 hour PMA and lonomycin stimulation. (F) Frequencies of CXCR5+ cells were quantified between each CTLA-4 and PD-1-expressing subset in the LN of 9 ART-treated, SIV-infected RMs at day 90 post-SIV infection (38–41 days post-ART initiation). The results shown are from unstimulated lymphocytes. Averaged data are presented as the mean ± SEM, and ANOVAs using Tukey’s adjustment for multiple comparisons were used to compare differences between subsets. *, p<0.05; **, p<0.01; ***, p<0.001; ****, p<0.0001. Please also see figure S6.
Figure 3
Figure 3. SIV DNA is found outside the B cell follicle in CTLA-4+PD-1 cells
(A) Immunofluorescence staining for CTLA-4 (green) and PD-1 (blue) combined with DNAscope hybridization for SIV vDNA (red) in the LN T cell zone (TCZ) and B cell follicle of a representative RM (RJf13). Representative images are shown for each anatomic location within the LN following ART (RJf13: D315 p.i.) in the absence of detectable plasma viremia (n=7). Scale bars = 25 µm. The white box highlights the expanded view on the right. (B) Quantitative image analysis for the TCZ and B cell follicle of the LN demonstrating the fraction of SIV vDNA+ cells that express CTLA-4 and/or PD-1 in SIV-infected RMs (n=7) at 3 separate time points: PreART, Early ART (90 days post-SIV infection, 38–41 days post-ART initiation), and Mid ART (average time since last undetectable plasma viral load being approximately 80 ± 40 d). (C) Fold change in the fraction of vDNA+ cells in the TCZ that express CTLA-4, or lack its expression, was calculated using the DNAscope quantification of 6 RMs between the Early ART and PreART time points. Fold change is also shown for the fraction of vDNA+ cells in the B cell follicle that express PD-1 and CTLA-4 (P+C+) and those that lack their expression (PC) using the DNAscope quantification of 6 RMs between the Mid ART and PreART time points. Data are presented as mean ± SEM, with a dashed line corresponding to FC=1 (no change).
Figure 4
Figure 4. CTLA-4+PD-1 memory CD4+ T cells harbor replication competent SIV
(A) Memory CD4+ T cells from ART-treated, SIV-infected RM LNs were stimulated for three hours using PMA and lonomycin (see Methods), sorted based on CTLA-4 and PD-1 expression (see Figure S2A), and co-cultured with SIV-permissive CEMx174 cells for 35 days (n=7). Representative flow plots of intracellular SIV GAG p27 are shown for days 14 and 35 of co-culture within PD-1+CTLA-4+ and CTLA-4+PD-1 subsets from an individual ART-treated, SIV-infected RM (RJf13) (n=7). The right column shows SIV GAG p27 staining for a positive control (CEMx174 cells infected directly with SIVmac). (B) SIVGAG RNA was quantified at days 14 and 35 from the supernatant of the individual co-cultures. Each set of columns represents the SIV RNA data from the PD-1+CTLA-4+ (blue) and CTLA-4+PD-1 (green) memory CD4+ T cell subsets from an individual RM (n=7). Due to cell number limitations, only PD-1+CTLA-4+ memory CD4+ T cells had replicate wells; the SIV RNA data for this subset represents the average of the three replicate wells for animals RFj13, RPu12, and RLm12. (C) Uninfected CEMx174 cells were spiked using the clarified co-culture supernatant at day 35 (see Methods). Representative flow cytometry gates of intracellular SIV GAG p27 in CEMx174 cells at day 7 corresponding to the co-cultured CTLA-4+PD-1 subsets for four RMs (RLr10, RWo10, RTb12, and RGv10) as well as the positive and negative control.
Figure 5
Figure 5. Frequencies CTLA-4+PD-1 memory CD4+ T cells and their viral seeding predicts viral persistence during ART
Correlations between the frequencies of CTLA-4+PD-1(A) or PD-1+CTLA-4+ (B) memory CD4+ T cells in the LN at the peak of SIV infection (day 14) and the fraction of viral DNA (vDNA) found within C+P in the TCZ (A) and P+C+ in the B cell follicle (B) prior to ART initiation by DNAscope. Only 5 SIV-infected RMs had measurements to relate in this analysis; all are shown. The frequencies of CTLA-4+PD-1 memory CD4+ T cells in the LN at the peak of SIV infection (day 14) are significantly associated with the frequencies of bulk memory (C; p=0.0353) and memory PD-1+CTLA-4+ (D; p=0.0258) CD4+ T cells harboring SIVG/AG DNA in the LN at necropsy (average time of ART-mediated viral suppression: 125 ± 76 days; n=8). (E) Correlation between the frequency of PD-1+CTLA-4+ memory CD4+ T cells in the LN at day 14 and the frequencies of memory PD-1+CTLA-4+ CD4+ T cells harboring SIV DNA in the LN at necropsy. The fraction of SIV DNA+ cells expressing CTLA-4+PD-1 in the TCZ preART initiation was positively correlated with time to viral load suppression (F; p=0.0641) and quantity of SIV DNA in PD-1+CTLA-4+ memory CD4+ T cells in the LN (G; p=0.0286) at necropsy. (H) The correlation is also shown between the fraction of SIV DNA+cells expressing PD-1+CTLA-4+ in the B cell follicle PreART initiation and the frequencies of memory PD-1+CTLA-4+ CD4+ T cells harboring SIV DNA in the LN at necropsy. All statistical analyses were performed using Pearson product-moment correlation tests.
Figure 6
Figure 6. CTLA-4+PD-1 CD4+ T cells demonstrate increased potential for survival and homeostatic proliferation
The representative mean fluorescence intensity (MFI) of Bcl2 (A) and pSTAT5 (B) expression is shown for CTLA-4 and PD-1-expressing memory CD4+ T cells from the LN of an individual ART-treated, SIV-infected RM. Aggregate MFI data are then shown for each molecule for 9 ART-treated, SIV-infected RMs. Frequencies of Bcl2+ (A) and pSTAT5+ (B) cells were quantified in the LN of 9 ART-treated, SIV-infected RMs at day 90 post-SIV infection (38–41 days post-ART initiation). Of note, Bcl2 and pSTAT5 expression were determined ex vivo, with CTLA-4 expression measured intracellularly. Averaged data are presented as the mean ± SEM, and ANOVAs using Tukey’s adjustment for multiple comparisons were used to compare differences between subsets. *, p<0.05; ***, p<0.001; ****, p<0.0001. Correlations are shown between the frequencies of CTLA-4+PD-1 (C) or PD-1+CTLA-4+ (D) memory CD4+ T cells in the LN during early ART expressing pSTAT5 and the fraction of viral DNA (vDNA) found within C+P in the TCZ (C) and P+C+ in the B cell follicle (D) at MidART by DNAscope (MidART average time since last undetectable plasma viremia being approximately 80 ± 40 d). Statistical analyses were performed using Pearson product-moment correlation tests.
Figure 7
Figure 7. HIV DNA is also found outside the B-cell follicle in CTLA-4+PD-1 cells in ART-suppressed HIV-infected individuals
(A) Representative image (Pt. 27) of immunofluorescence staining for CTLA-4 (green) and PD-1 (blue) combined with DNAscope hybridization for HIV vDNA (red) in the LN T cell zone (TCZ); Magnification X600. (B) Quantitative image analysis for the TCZ of the LN demonstrating the fraction of HIV vDNA+ cells that express CTLA-4 and/or PD-1 in ART-treated HIV-infected individuals (n=6) with undetectable plasma viral loads (average duration of aviremia is 31.4 months; range of 15.650.5 months).

Similar articles

Cited by

References

    1. Amara RR, Villinger F, Altman JD, Lydy SL, O’Neil SP, Staprans SI, Montefiori DC, Xu Y, Herndon JG, Wyatt LS, et al. Control of a mucosal challenge and prevention of AIDS by a multiprotein DNA/MVA vaccine. Science. 2001;292:69–74. - PubMed
    1. Anderson A, Martens CL, Hendrix R, Stempora LL, Miller WP, Hamby K, Russell M, Strobert E, Blazar BR, Pearson TC, et al. Expanded nonhuman primate tregs exhibit a unique gene expression signature and potently downregulate alloimmune responses. American Journal of Transplantation. 2008;8:2252–2264. - PMC - PubMed
    1. Autran B, Carcelain G, Li TS, Blanc C, Mathez D, Tubiana R, Katlama C, Debre P, Leibowitch J. Positive effects of combined antiretroviral therapy on CD4+ T cell homeostasis and function in advanced HIV disease. Science. 1997;277:112–116. - PubMed
    1. Baine I, Basu S, Ames R, Sellers RS, Macian F. Helios induces epigenetic silencing of IL2 gene expression in regulatory T cells. J Immunol. 2013;190:1008–1016. - PMC - PubMed
    1. Banga R, Procopio FA, Noto A, Pollakis G, Cavassini M, Ohmiti K, Corpataux JM, de Leval L, Pantaleo G, Perreau M. PD-1 and follicular helper T cells are responsible for persistent HIV-1 transcription in treated aviremic individuals. Nat Med 2016 - PubMed

Publication types

MeSH terms

Substances