Immunofluorescent characterization of non-myelinating Schwann cells and their interactions with immune cells in mouse mesenteric lymph node
- PMID: 29046050
- PMCID: PMC5572407
- DOI: 10.4081/ejh.2017.2827
Immunofluorescent characterization of non-myelinating Schwann cells and their interactions with immune cells in mouse mesenteric lymph node
Abstract
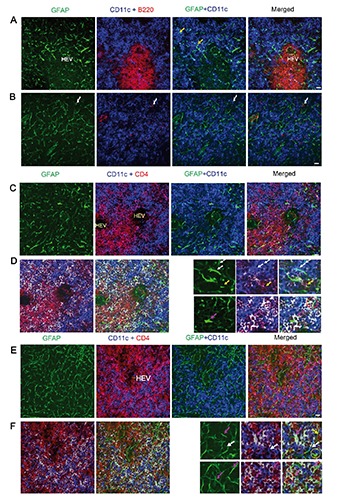
The central nervous system (CNS) influences the immune system in a general fashion by regulating the systemic concentration of humoral substances, whereas the autonomic nervous system communicates specifically with the immune system according to local interactions. Data concerning the mechanisms of this bidirectional crosstalk of the peripheral nervous system (PNS) and immune system remain limited. To gain a better understanding of local interactions of the PNS and immune system, we have used immunofluorescent staining of glial fibrillary acidic protein (GFAP), coupled with confocal microscopy, to investigate the non-myelinating Schwann cell (NMSC)-immune cell interactions in mouse mesenteric lymph nodes. Our results demonstrate i) the presence of extensive NMSC processes and even of cell bodies in each compartment of the mouse mesenteric lymph node; ii) close associations/interactions of NMSC processes with blood vessels (including high endothelial venules) and the lymphatic vessel/sinus; iii) close contacts/associations of NMSC processes with various subsets of dendritic cells (such as CD4+CD11c+, CD8+CD11c+ dendritic cells), macrophages (F4/80+ and CD11b+ macrophages), and lymphocytes. Our novel findings concerning the distribution of NMSCs and NMSC-immune cell interactions inside the mouse lymph node should help to elucidate the mechanisms through which the PNS affects cellular- and humoral-mediated immune responses or vice versa in health and disease.
Conflict of interest statement
Conflict of interest: None of the authors has a conflict of interest to declare.
Figures


Similar articles
-
Immunofluorescent Localization of Non-myelinating Schwann Cells and Their Interactions With Immune Cells in Mouse Thymus.J Histochem Cytochem. 2018 Nov;66(11):775-785. doi: 10.1369/0022155418778543. Epub 2018 May 18. J Histochem Cytochem. 2018. PMID: 29775115 Free PMC article.
-
Distribution of non-myelinating Schwann cells and their associations with leukocytes in mouse spleen revealed by immunofluorescence staining.Eur J Histochem. 2018 Apr 3;62(2):2890. doi: 10.4081/ejh.2018.2890. Eur J Histochem. 2018. PMID: 29943953 Free PMC article.
-
Immunofluorescence characterization of innervation and nerve-immune cell interactions in mouse lymph nodes.Eur J Histochem. 2019 Oct 18;63(4):3059. doi: 10.4081/ejh.2019.3059. Eur J Histochem. 2019. PMID: 31631646 Free PMC article.
-
Bidirectional crosstalk between the peripheral nervous system and lymphoid tissues/organs.Front Immunol. 2023 Sep 12;14:1254054. doi: 10.3389/fimmu.2023.1254054. eCollection 2023. Front Immunol. 2023. PMID: 37767094 Free PMC article. Review.
-
The lymph node neutrophil.Semin Immunol. 2016 Apr;28(2):129-36. doi: 10.1016/j.smim.2016.03.008. Epub 2016 Mar 26. Semin Immunol. 2016. PMID: 27025975 Review.
Cited by
-
Histochemistry as a versatile research toolkit in biological research, not only an applied discipline in pathology.Eur J Histochem. 2018 Dec 21;62(4):3006. doi: 10.4081/ejh.2018.3006. Eur J Histochem. 2018. PMID: 30572698 Free PMC article.
-
GFAP and desmin expression in lymphatic tissues leads to difficulties in distinguishing between glial and stromal cells.Sci Rep. 2021 Jun 25;11(1):13322. doi: 10.1038/s41598-021-92364-z. Sci Rep. 2021. PMID: 34172765 Free PMC article.
-
Innervation and nerve-immune cell contacts in mouse Peyer's patches.Histol Histopathol. 2020 Apr;35(4):371-383. doi: 10.14670/HH-18-158. Epub 2019 Sep 5. Histol Histopathol. 2020. PMID: 31486062
-
A journal of histochemistry as a forum for non-histochemical scientific societies.Eur J Histochem. 2019 Dec 23;63(4):3106. doi: 10.4081/ejh.2019.3106. Eur J Histochem. 2019. PMID: 31868322 Free PMC article.
-
Immunofluorescent Localization of Non-myelinating Schwann Cells and Their Interactions With Immune Cells in Mouse Thymus.J Histochem Cytochem. 2018 Nov;66(11):775-785. doi: 10.1369/0022155418778543. Epub 2018 May 18. J Histochem Cytochem. 2018. PMID: 29775115 Free PMC article.
References
-
- Razavi R, Chan Y, Afifiyan FN, Liu XJ, Wan X, Yantha J, et al. TRPV1+ sensory neurons control beta cell stress and islet inflammation in autoimmune diabetes. Cell 2006;127:1123-35. - PubMed
MeSH terms
Substances
LinkOut - more resources
Full Text Sources
Other Literature Sources
Research Materials
Miscellaneous