Topographic distribution pattern of morphologically different G cells in the murine antral mucosa
- PMID: 29046055
- PMCID: PMC5658698
- DOI: 10.4081/ejh.2017.2810
Topographic distribution pattern of morphologically different G cells in the murine antral mucosa
Abstract
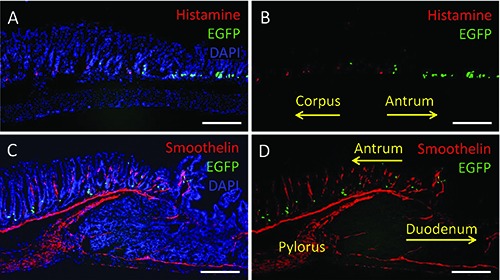
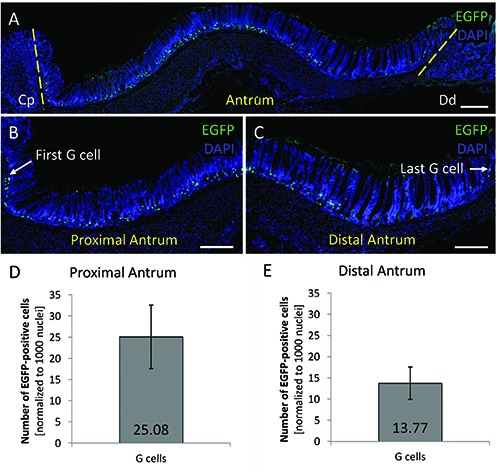
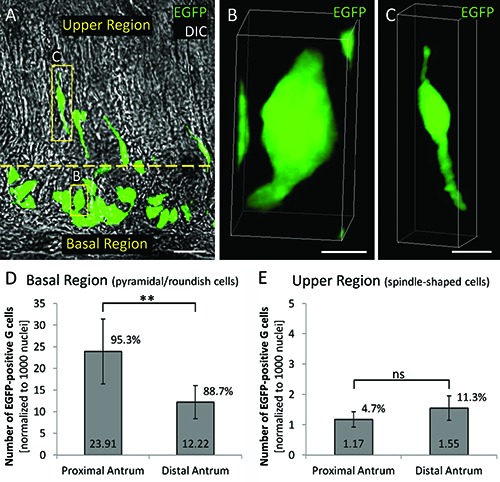
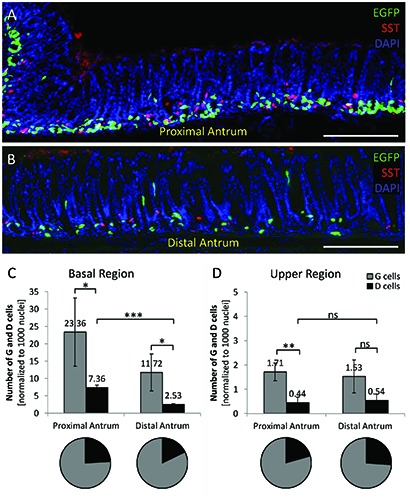
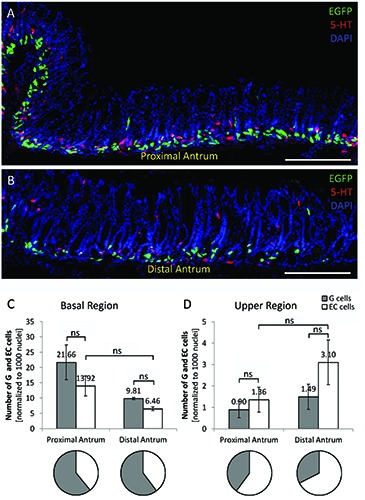
Gastrin-secreting enteroendocrine cells (G cells) in the antrum play an important role in the regulation of gastric secretion, gastric motility and mucosal cell proliferation. Recently we have uncovered the existence of two subpopulations of G cells with pivotally different morphology and a distinct localization in the antral invaginations; the functional implications of the different G cell types are still elusive. In this study a transgenic mouse line in which EGFP is expressed under the control of a gastrin promoter was used to elucidate the distribution pattern of the two G cell types throughout the different regions of the antrum. The results of immunohistochemical analyses revealed that G cells were not equally distributed along the anterior/posterior axis of the antrum. The "typical" pyramidal- or roundish-shaped G cells, which are located in the basal region of the antral invaginations, were more abundant in the proximal antrum bordering the corpus region but less frequent in the distal antrum bordering the pylorus. In contrast, the "atypical" G cells, which are located in the upper part of the antral invaginations and have a spindle-like contour with long processes, were evenly distributed along the anterior/posterior axis. This characteristic topographic segregation supports the notion that the two G cell types may serve different functions. A comparison of the antrum specific G cells with the two pan-gastrointestinal enteroendocrine cell types, somatostatin-secreting D cells and serotonin-secreting enterochromaffin (EC) cells, revealed a rather similar distribution pattern of G and D cells, but a fundamentally different distribution of EC cells. These observations suggest that distinct mechanisms govern the spatial segregation of enteroendocrine cells in the antrum mucosa.
Conflict of interest statement
Conflict of interest: the authors declare that no conflict of interest exists.
Figures
Similar articles
-
Mechanosensitive ion channel Piezo1 is expressed in antral G cells of murine stomach.Cell Tissue Res. 2018 Feb;371(2):251-260. doi: 10.1007/s00441-017-2755-0. Epub 2017 Dec 20. Cell Tissue Res. 2018. PMID: 29264643 Free PMC article.
-
Ultrastructural immunohistochemical localization of gastrin, somatostatin and serotonin in endocrine cells of human antral gastric mucosa.Acta Histochem. 2003;105(2):191-201. doi: 10.1078/0065-1281-00703. Acta Histochem. 2003. PMID: 12831171
-
Complex morphology of gastrin-releasing G-cells in the antral region of the mouse stomach.Cell Tissue Res. 2016 Nov;366(2):301-310. doi: 10.1007/s00441-016-2455-1. Epub 2016 Jul 9. Cell Tissue Res. 2016. PMID: 27392412
-
[Pathomorphologic studies of the endocrine cells in the gastrointestinal mucosa. Physiology, cytochemistry and ultrastructure (author's transl].Veroff Pathol. 1977;104:1-203. Veroff Pathol. 1977. PMID: 190818 Review. German.
-
Classification of gastric endocrine cells at the light and electron microscopical levels.Microsc Res Tech. 2000 Mar 1;48(5):258-71. doi: 10.1002/(SICI)1097-0029(20000301)48:5<258::AID-JEMT3>3.0.CO;2-Q. Microsc Res Tech. 2000. PMID: 10700043 Review.
Cited by
-
Distinct Cell Types With the Bitter Receptor Tas2r126 in Different Compartments of the Stomach.Front Physiol. 2020 Feb 7;11:32. doi: 10.3389/fphys.2020.00032. eCollection 2020. Front Physiol. 2020. PMID: 32116750 Free PMC article.
-
Mechanosensitive ion channel Piezo1 is expressed in antral G cells of murine stomach.Cell Tissue Res. 2018 Feb;371(2):251-260. doi: 10.1007/s00441-017-2755-0. Epub 2017 Dec 20. Cell Tissue Res. 2018. PMID: 29264643 Free PMC article.
-
Histochemistry as a versatile research toolkit in biological research, not only an applied discipline in pathology.Eur J Histochem. 2018 Dec 21;62(4):3006. doi: 10.4081/ejh.2018.3006. Eur J Histochem. 2018. PMID: 30572698 Free PMC article.
-
CHRONIC USE OF PROTON PUMP INHIBITORS AND THE QUANTITY OF G, D, AND ECL CELLS IN THE STOMACH.Arq Bras Cir Dig. 2020;33(2):e1506. doi: 10.1590/0102-672020190001e1506. Epub 2020 Aug 24. Arq Bras Cir Dig. 2020. PMID: 32844883 Free PMC article.
References
MeSH terms
LinkOut - more resources
Full Text Sources
Other Literature Sources