

Time Trends of Dietary and Lifestyle Factors and Their Potential Impact on Diabetes Burden in China
- PMID: 29046327
- PMCID: PMC5862128
- DOI: 10.2337/dc17-0571
Time Trends of Dietary and Lifestyle Factors and Their Potential Impact on Diabetes Burden in China
Erratum in
-
Erratum. Time Trends of Dietary and Lifestyle Factors and Their Potential Impact on Diabetes Burden in China. Diabetes Care 2017;40:1685-1694.Diabetes Care. 2018 May;41(5):1116. doi: 10.2337/dc18-er05. Epub 2018 Mar 16. Diabetes Care. 2018. PMID: 29549084 Free PMC article. No abstract available.
Abstract
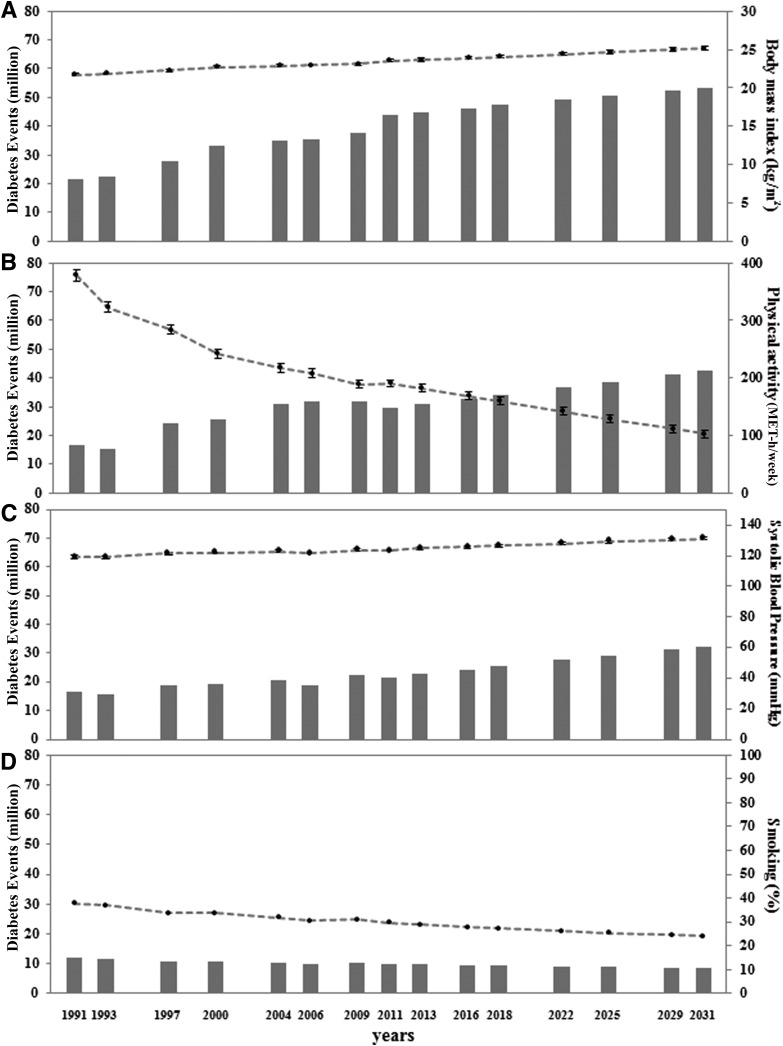
Objective: To examine the secular trends in risk factors, estimate their impact on type 2 diabetes burden from 1991 to 2011, and project trends in the next 20 years.
Research design and methods: Risk factor distributions were based on data from the China Health and Nutrition Survey 1991-2011. Diabetes cases attributable to all nonoptimal levels of each risk factor were estimated by applying the comparative risk assessment method.
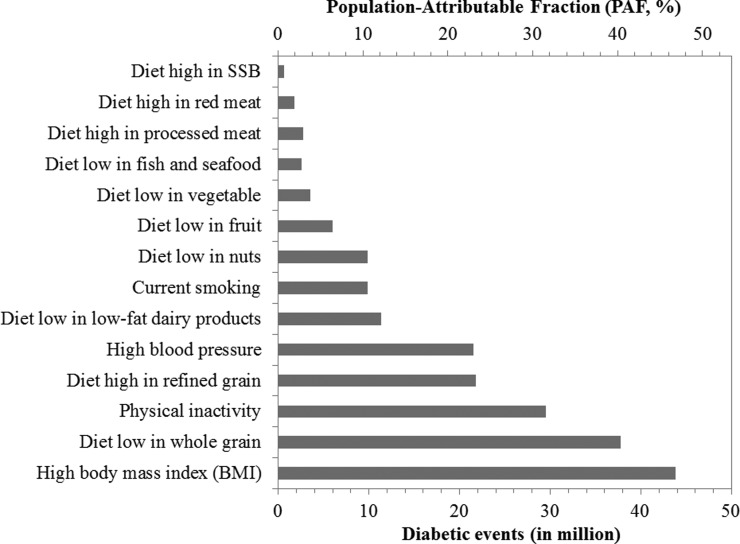
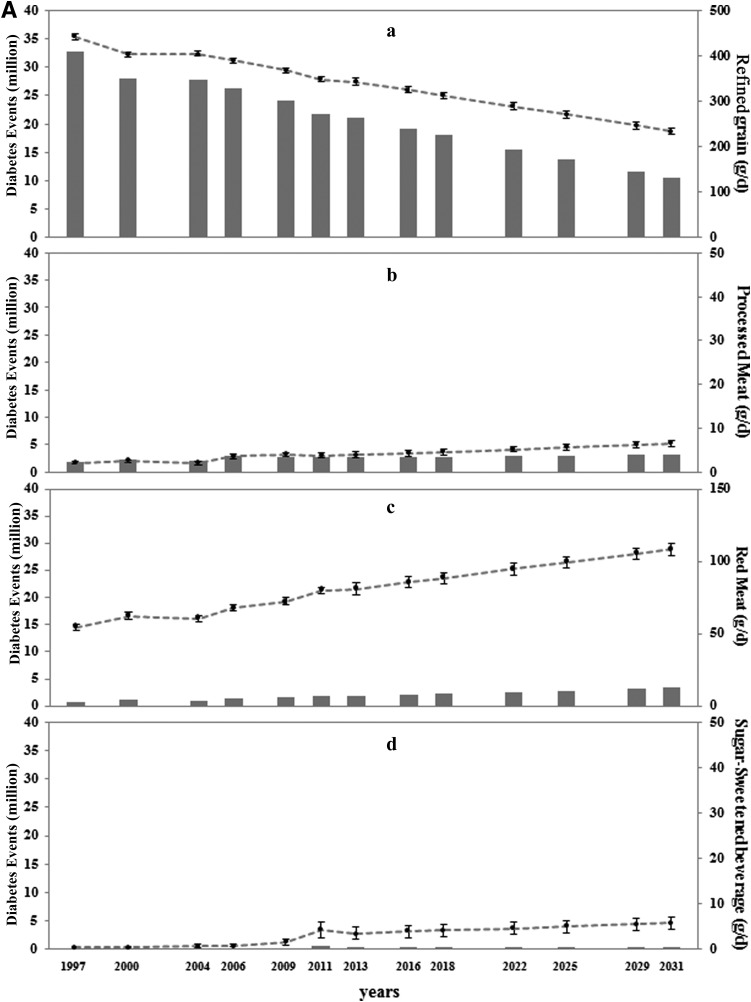
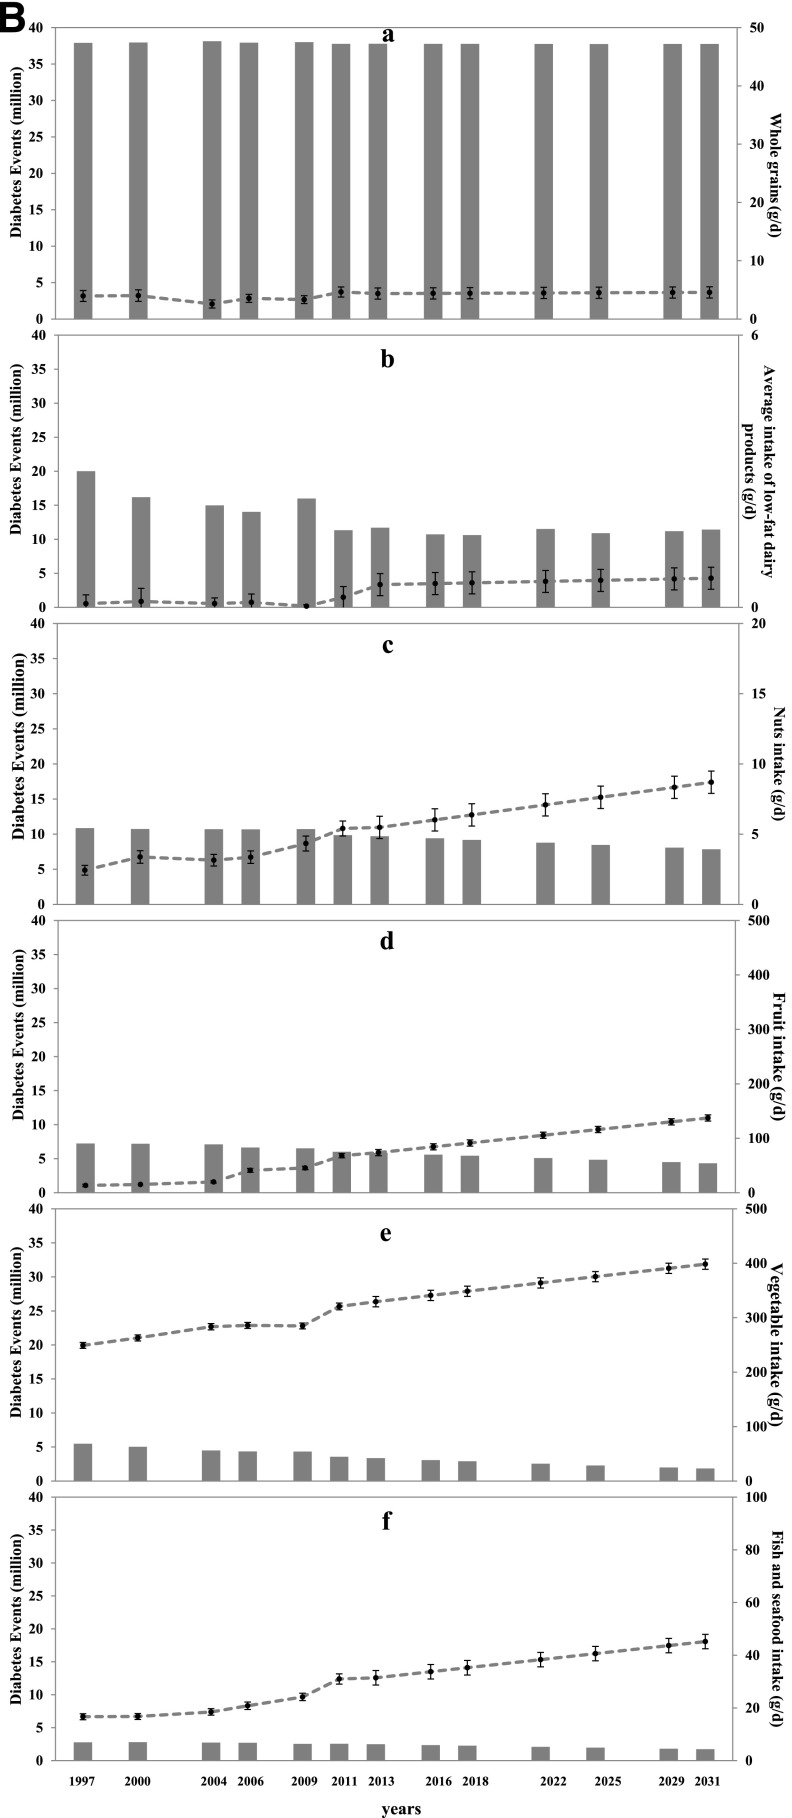
Results: In 2011, high BMI was the leading individual attributable factor for diabetes cases in China responsible for 43.8 million diabetes cases with a population-attributable fraction of 46.8%. Low whole-grain intake and high refined grain intake were the leading dietary risk factors in China responsible for 37.8 million and 21.8 million diabetes-attributable cases, respectively. The number of attributable diabetes cases associated with low physical activity, high blood pressure, and current smoking was 29.5, 21.6, and 9.8 million, respectively. Although intakes of low-fat dairy products, nuts, fruit, vegetables, and fish and seafood increased moderately over time, the average intake was below optimal levels in 2011 and were responsible for 15.8, 11.3, 9.9, 6.0, 3.6, and 2.6 million diabetes cases, respectively. Meanwhile, intakes of processed meat, red meat, and sugar-sweetened beverage showed increasing trends over time and were responsible for 2.8, 1.8, and 0.5 million diabetes cases, respectively, in 2011.
Conclusions: A high BMI and low intake of whole grains but high intake of refined grains are the most important individual risk factors related to Chinese diabetes burden; low physical activity and high blood pressure also significantly contributed.
© 2017 by the American Diabetes Association.
Figures
Comment in
-
Comment on Li et al. Time Trends of Dietary and Lifestyle Factors and Their Potential Impact on Diabetes Burden in China. Diabetes Care 2017;40:1685-1694.Diabetes Care. 2018 May;41(5):e82. doi: 10.2337/dc18-0143. Diabetes Care. 2018. PMID: 29678872 No abstract available.
-
Response to Comment on Li et al. Time Trends of Dietary and Lifestyle Factors and Their Potential Impact on Diabetes Burden in China. Diabetes Care 2017;40:1685-1694.Diabetes Care. 2018 May;41(5):e83. doi: 10.2337/dci18-0008. Diabetes Care. 2018. PMID: 29678873 No abstract available.
References
-
- Yang W, Lu J, Weng J, et al.; China National Diabetes and Metabolic Disorders Study Group . Prevalence of diabetes among men and women in China. N Engl J Med 2010;362:1090–1101 - PubMed
-
- National Diabetes Prevention Collaborative Group A mass survey of diabetes mellitus in a population of 300,000 in 14 provinces and municipalities in China. Zhonghua Nei Ke Za Zhi 1981;20:678–683 [author's translation] - PubMed
-
- Pan XR, Yang WY, Li GW, Liu J; National Diabetes Prevention and Control Cooperative Group . Prevalence of diabetes and its risk factors in China, 1994. Diabetes Care 1997;20:1664–1669 - PubMed
-
- Li LM, Rao KQ, Kong LZ, et al.; Technical Working Group of China National Nutrition and Health Survey . A description on the Chinese national nutrition and health survey in 2002. Zhonghua Liu Xing Bing Xue Za Zhi 2005;26:478–484 [in Chinese] - PubMed
MeSH terms
Substances
Grants and funding
LinkOut - more resources
Full Text Sources
Other Literature Sources
Medical
