. 2017 Oct;14(135):20170580.
doi: 10.1098/rsif.2017.0580.

Regulation of valve interstitial cell homeostasis by mechanical deformation: implications for heart valve disease and surgical repair

Affiliations

Regulation of valve interstitial cell homeostasis by mechanical deformation: implications for heart valve disease and surgical repair

Salma Ayoub et al. J R Soc Interface. 2017 Oct.

Abstract

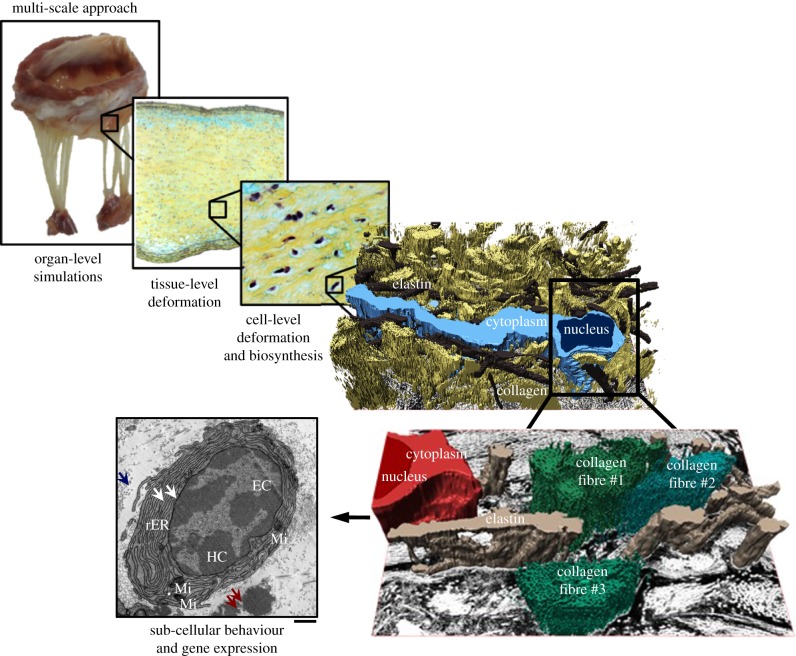
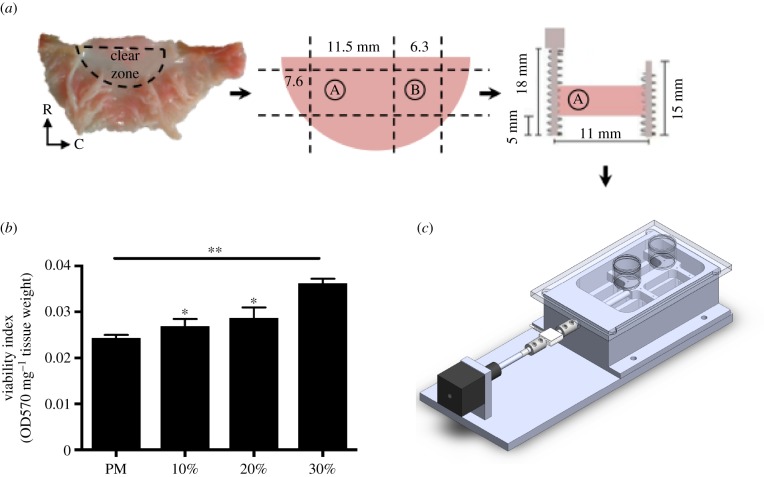
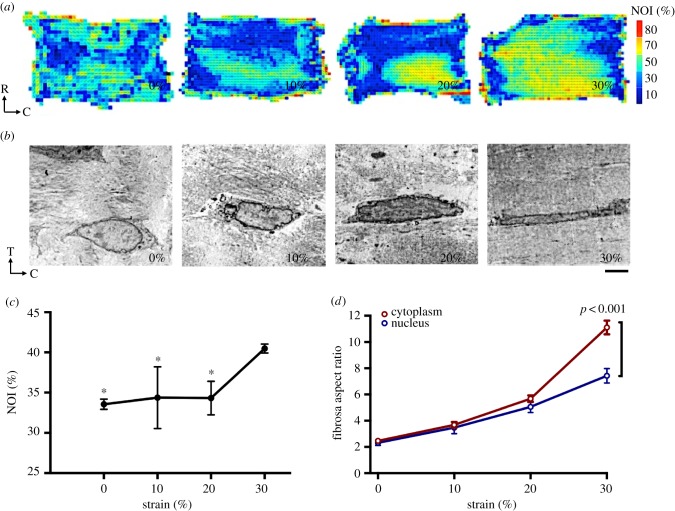
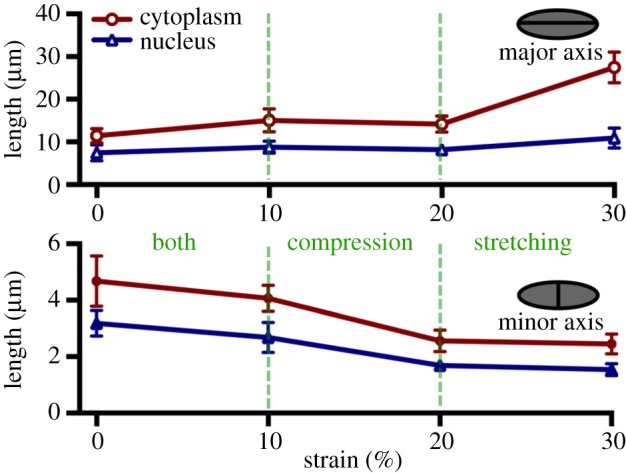
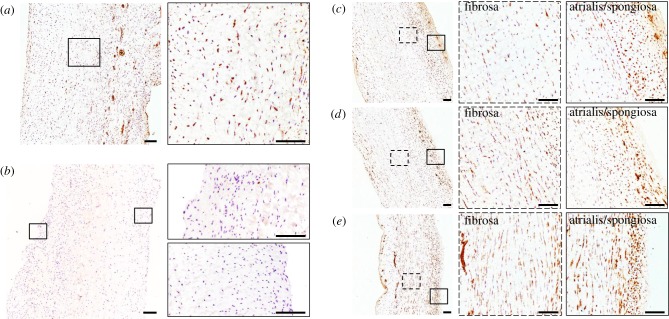
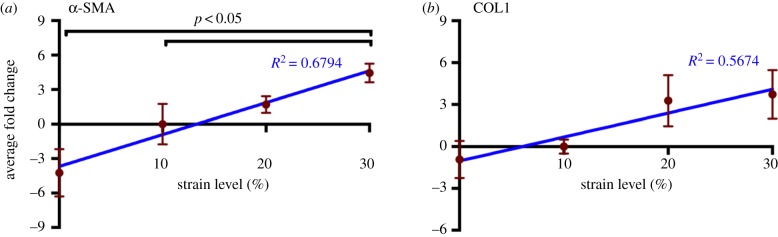
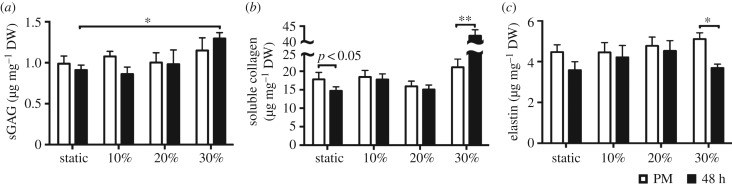
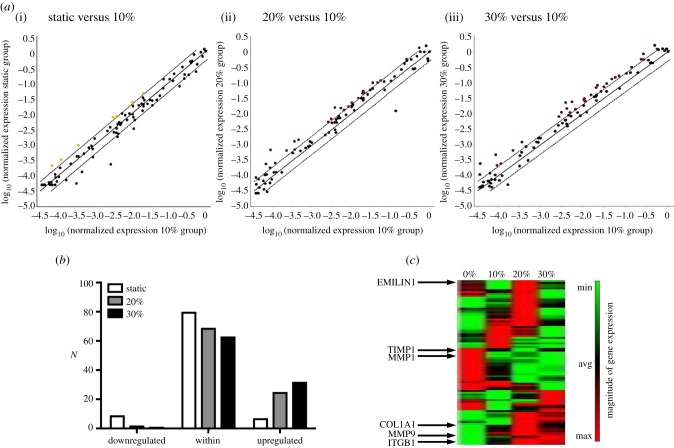
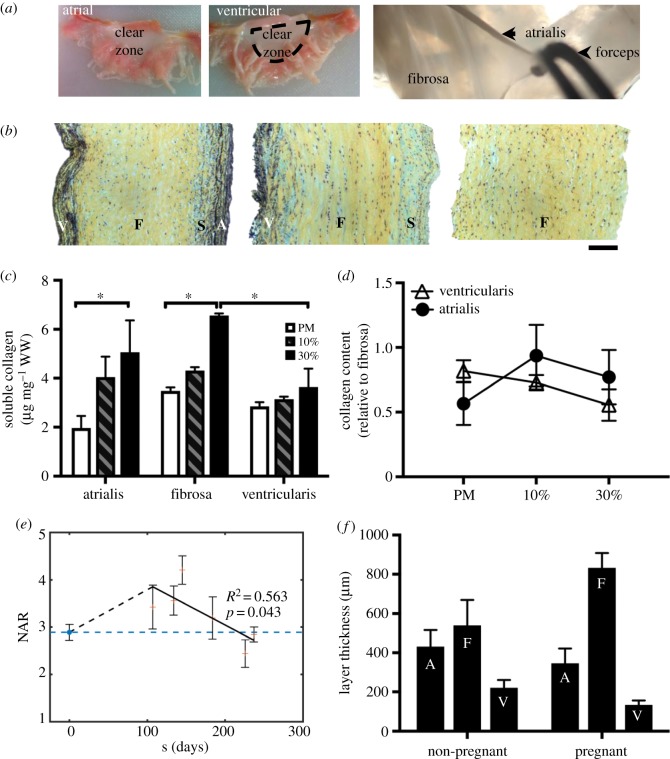
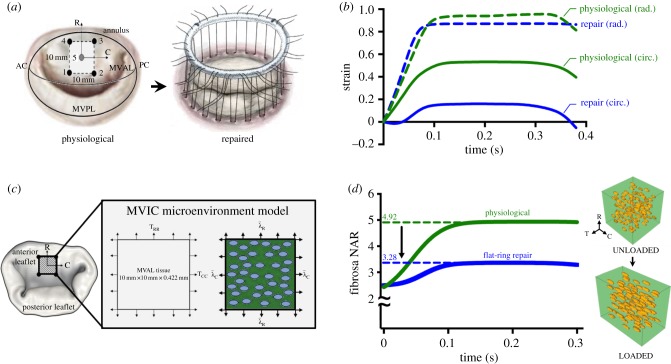
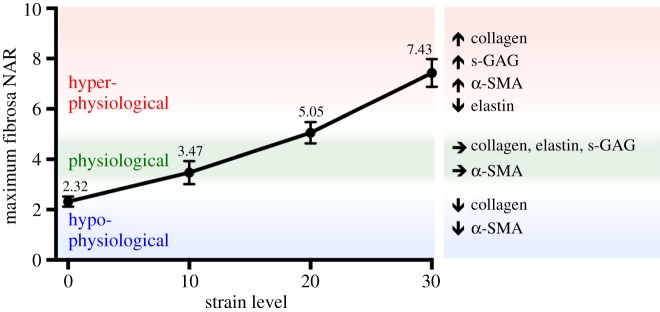
Mechanical stress is one of the major aetiological factors underlying soft-tissue remodelling, especially for the mitral valve (MV). It has been hypothesized that altered MV tissue stress states lead to deviations from cellular homeostasis, resulting in subsequent cellular activation and extracellular matrix (ECM) remodelling. However, a quantitative link between alterations in the organ-level in vivo state and in vitro-based mechanobiology studies has yet to be made. We thus developed an integrated experimental-computational approach to elucidate MV tissue and interstitial cell responses to varying tissue strain levels. Comprehensive results at different length scales revealed that normal responses are observed only within a defined range of tissue deformations, whereas deformations outside of this range lead to hypo- and hyper-synthetic responses, evidenced by changes in α-smooth muscle actin, type I collagen, and other ECM and cell adhesion molecule regulation. We identified MV interstitial cell deformation as a key player in leaflet tissue homeostatic regulation and, as such, used it as the metric that makes the critical link between in vitro responses to simulated equivalent in vivo behaviour. Results indicated that cell responses have a delimited range of in vivo deformations that maintain a homeostatic response, suggesting that deviations from this range may lead to deleterious tissue remodelling and failure.

Keywords: collagen; myofibroblast; valve interstitial cells.


Conflict of interest statement

The authors declare no conflict of interest.

Figures

Figure 1.
Figure 1.
This study enables us to investigate the effect of mechanical stimuli on VICs at different length scales that encompass organ-level simulations, tissue-level deformations, cell-level deformation and extracellular matrix biosynthesis, and sub-cellular behaviour and gene expression. Included in the diagram are the following: (1) three-dimensional rendition of the MVIC micro-environment from serial focused ion beam scanning electron microscopy micrographs. (2) Transmission electron micrograph of a representative myofibroblast, characterized by the highly convoluted rough endoplasmic reticulum (rER). White arrows: rER, blue arrows: collagen fibrils, red arrows: amorphous elastin. EC, euchromatin; HC, heterochromatin; Mi, mitochondria. Scale bar, 1 µm. (Online version in colour.)
Figure 2.
Figure 2.
Mitral valve anterior leaflets (MVAL) samples were subjected to circumferential cyclic strain using a custom-designed load-sensing tissue strip bioreactor. (a) MVAL with the clear zone labelled. All samples for the bioreactor treatment are taken from the clear zone due to tissue uniformity in that region. A: sample from the clear zone used as a post-mortem control sample, B: sample from the clear zone used for the bioreactor treatment. Samples to be treated in the bioreactor are sutured with springs on the two radial sides and strained along the circumferential direction. R, radial; C, circumferential. (b) Viability index data for post-mortem and cultured samples (10, 20, and 30%) measured using the MTT assay. Data are mean ± SEM, n = 4, *p < 0.05, **p < 0.01 compared to post-mortem. (c) Left: side view of the bioreactor and the different components: linear actuator (black), load cell (white), specimen chamber, and specimen chamber lid with T-flask caps. Right: top view of the bioreactor. (Online version in colour.)
Figure 3.
Figure 3.
Collagen fibre alignment and cellular deformation demonstrate nonlinear tissue micromechanics at higher strain levels. (a) Collagen fibre alignment maps at 0% (unstrained), 10% (physiological strain), 20%, and 30% (hyper-physiological strain). NOI, normalized orientation index. Warmer colours represent more highly aligned tissue. (b) Representative mitral valve interstitial cells from the fibrosa layer from samples stretched at different strain levels. T, transmural/thickness; C, circumferential. Scale bar: 5 µm. (c) NOI was averaged for all regions of the sample to find a representative NOI for the sample and averaged for all three samples. The NOI value at 0%, 10%, and 20% are significantly higher than at 30% (p < 0.05). Data are mean ± SEM, n = 3, *p < 0.05. (d) Nuclear and cytoplasmic aspect ratios (n = 3, 10 cells per each) at different strain levels. Data are mean ± SEM. Cytoplasmic AR is significantly higher than nuclear AR (p < 0.001) at hyper-physiological strain levels (30%). (Online version in colour.)
Figure 4.
Figure 4.
Length in micrometres of cytoplasm (red) and nucleus (blue) along the major (circumferential) and minor (transmural) axes. Deformation occurs mainly along the direction of the applied circumferential strain with minimal compression along the transmural direction: at higher strain levels, the deformation along the major axis accounts for the large aspect ratio. Data are mean ± SEM. (Online version in colour.)
Figure 5.
Figure 5.
Representative micrographs of α-SMA expression in post-mortem MV samples (a) and after a 48-h cyclic stretch treatment at 10% (c), 20% (d) and 30% (e). The higher levels of α-SMA expression in VICs within the fibrosa layer suggest cellular activation and phenotypic transition from a fibroblast-like phenotype to a myofibroblast-like phenotype at higher strain levels. (b) Representative micrographs of CD31 expression of post-mortem control sample demonstrate successful removal of endothelial cells from the outer layers of the valve samples prior to the bioreactor treatment. Scale bar, 250 µm. (Online version in colour.)
Figure 6.
Figure 6.
Cyclic strain leads to an increase in α-SMA and type I collagen gene expression. qPCR reveals a linear increase with strain in both (a) α-SMA (R2 = 0.6794, p = 0.001) and (b) type I collagen gene expression (R2 = 0.5674, p = 0.0191). Data are mean ± SEM, n = 3 samples. All data are referenced to the average of the 10% group. (Online version in colour.)
Figure 7.
Figure 7.
Extracellular matrix composition. All bar graphs, mean ± SEM, n = 8, *p < 0.05, **p < 0.01, white: post-mortem, black: post-stimulation samples (after 48 h). ECM content (s-GAG, collagen, and elastin) quantified with colorimetric assays is presented in microgram per milligram dry weight. (a) s-GAG content increases after the 30% cyclic strain treatment. (b) Sircol colorimetric assay demonstrates that static incubation at 0% strain resulted in a significant decrease (p < 0.05) in acid–pepsin soluble collagen, whereas a significant increase is observed at the 30% hyper-physiological strain level. (c) A significant decrease in elastin content is observed at the hyper-physiological strain level. (Online version in colour.)
Figure 8.
Figure 8.
RT2 Profiler PCR array for 84 ECM and cell adhesion molecule genes indicates an overall downregulation of some of these genes after static (0% strain) incubation and an upregulation of gene expression at higher strain levels (20% and 30%). (a) Scatter plots compare the normalized expression of every gene on the RT2 Profiler PCR array between two groups: (i–iii) static versus 10%, 20% versus 10%, and 30% versus 10%. The central solid line indicates unchanged gene expression and the dotted lines indicate the fold regulation threshold (=2). Genes that are above and below the dotted line meet the fold regulation threshold and are significantly upregulated or downregulated, respectively. Fold change was calculated by using the 10% group as the calibrator. Specific genes and corresponding fold changes are included in the electronic supplementary material. (b) Total number of genes (N) that are either below (downregulated), within, or above (upregulated) the fold regulation threshold at different strain levels. (c) Heat map of gene expression magnitude for all four groups (0%, 10%, 20%, and 30%) with key genes highlighted: EMILIN1, TIMP1, MMP1, COL1A1, MMP9, and ITGB1. (Online version in colour.)
Figure 9.
Figure 9.
Layer-specific analysis. (a) Layer separation technique: atrial and ventricular sides are shown. The atrialis is separated from the fibrosa as shown in the image. (b) Layer-specific analysis: Movat-stained sections of MVAL samples after layer separation. From left to right: intact anterior leaflet sample with all four layers, leaflet with the atrialis removed, leaflet with both ventricularis and atrialis removed. A, atrialis; S, spongiosa; F, fibrosa; V, ventricularis. Scale bar: 100 µm. (c) Acid–pepsin soluble collagen content (microgram per milligram wet weight) in the separated atrialis, fibrosa, and ventricularis quantified for the post-mortem, 10% and 30% samples. Data are mean ± SEM, n = 3 samples, *p < 0.05. A significant soluble collagen content increase is observed at the hyper-physiological strain level (30%) in both the atrialis and fibrosa layers. (d) Collagen content relative to the fibrosa for the post-mortem, 10%, and 30% groups. (e) Measured NAR for both non-pregnant (NP) and pregnant (P) bovine specimens (post-mortem), highlighting an initial increase in NAR in early pregnancy (EP) followed by a gradual recovery to the pre-pregnancy value. These data underscore the relevance of our experimental work by linking it to the physiological phenomenon of pregnancy. Adapted with permission from [46]. (f) Previous layer-specific findings of growth and remodelling during pregnancy from [44,45]. (Online version in colour.)
Figure 10.
Figure 10.
Using a multi-scale approach to quantify the effect of surgical repair on the MVAL and subsequent MVIC deformation. (a) Schematic of physiological (i.e. normal/non-repaired) MV with corresponding diagram of the position of the five sonocrystals and an MV during flat-ring surgical repair. Heart valve schematics acquired from [63]. (b) Ovine in vivo tissue-level circumferential (solid lines) and radial strains (dotted lines) during ventricular systole for physiological (green) and surgically repaired valve (blue). In vivo kinematic data were acquired through sonocrystal array micrometry [50]. Flat-ring surgical repair leads to a decrease in the maximum circumferential strain, whereas the radial strain remains relatively constant. (c) Schematic diagrams of the MVIC micro-environment model with tissue-level deformations prescribed as boundary conditions whereby cells are included in the tissue model as ellipsoidal inclusions. Nonlinear FE simulations were performed by prescribing the in vivo tissue-level deformations shown in (b) as boundary conditions on the edges of the RVE and predicted deformation fields were analysed to quantify MVIC NAR. Adapted with permission from [48]. (d) Simulated in vivo fibrosa MVIC deformation in a physiological (non-repaired) MV and a surgically repaired MV, plotted in green and blue, respectively. Right: RVE (80 × 80 × 80 µm) of the fibrosa region of the MVAL (10 × 10 mm) with MVICs represented as ellipsoidal inclusions in the loaded and unloaded configurations for a normal (non-repaired/physiological) valve. In the normal valve, fibrosa MVICs reach a maximum NAR of 4.92, whereas those in the flat-ring repair reach an NAR of 3.28, suggesting that VICs are under-loaded after a flat-ring surgical repair. R, radial; C, circumferential; T, transmural. (Online version in colour.)
Figure 11.
Figure 11.
MVIC deformation is a major driver for cellular mechanoregulation. This plot shows the fibrosa NAR quantified in the experimental work at each strain level (shown in figure 3) and bracketed regions based on in vivo simulations from figure 9. A maximum fibrosa NAR that is less than 3.28 is bracketed as hypo-physiological, an NAR between 3.28 and 4.92 is bracketed as physiological and an NAR above 4.92 is hyper-physiological. This suggests that there is a narrow physiological range of MVIC NAR. (Online version in colour.)

References

    1. Chuong CJ, Fung YC. 1986. On residual stress in arteries. J. Biomech. Eng. 108, 189–192. (10.1115/1.3138600) - DOI - PubMed
    1. Fung YC. 1991. What are the residual stresses doing in our blood vessels? Ann. Biomed. Eng. 19, 237–249. (10.1007/BF02584301) - DOI - PubMed
    1. Lanir Y. 2009. Mechanisms of residual stress in soft tissues. J. Biomech. Eng. 131, 044506 (10.1115/1.3049863) - DOI - PubMed
    1. Ogden R. 2003. Nonlinear elasticity, anisotropy, material stability, and residual stresses in soft tissue. In Biomechanics of soft tissue in cardiovascular system (ed. Ogden RW.), pp. 65–108. New York, NY: Springer.
    1. Taber LA, Humphrey JD. 2001. Stress-modulated growth, residual stress, and vascular heterogeneity. J. Biomech. Eng. 123, 528–535. (10.1115/1.1412451) - DOI - PubMed

Publication types