. 2018 Jan;29(1):268-282.
doi: 10.1681/ASN.2017040436. Epub 2017 Oct 18.

Complement Activation in Peritoneal Dialysis-Induced Arteriolopathy

Affiliations

Complement Activation in Peritoneal Dialysis-Induced Arteriolopathy

Maria Bartosova et al. J Am Soc Nephrol. 2018 Jan.

Abstract

Cardiovascular disease (CVD) is the leading cause of increased mortality in patients with CKD and is further aggravated by peritoneal dialysis (PD). Children are devoid of preexisting CVD and provide unique insight into specific uremia- and PD-induced pathomechanisms of CVD. We obtained peritoneal specimens from children with stage 5 CKD at time of PD catheter insertion (CKD5 group), children with established PD (PD group), and age-matched nonuremic controls (n=6/group). We microdissected omental arterioles from tissue layers not directly exposed to PD fluid and used adjacent sections of four arterioles per patient for transcriptomic and proteomic analyses. Findings were validated in omental and parietal arterioles from independent pediatric control (n=5), CKD5 (n=15), and PD (n=15) cohorts. Transcriptomic analysis revealed differential gene expression in control versus CKD5 arterioles and in CKD5 versus PD arterioles. Gene ontology analyses revealed activation of metabolic processes in CKD5 arterioles and of inflammatory, immunologic, and stress-response cascades in PD arterioles. PD arterioles exhibited particular upregulation of the complement system and respective regulatory pathways, with concordant findings at the proteomic level. In the validation cohorts, PD specimens had the highest abundance of omental and parietal arteriolar C1q, C3d, terminal complement complex, and phosphorylated SMAD2/3, a downstream effector of TGF-β Furthermore, in the PD parietal arterioles, C1q and terminal complement complex abundance correlated with the level of dialytic glucose exposure, abundance of phosphorylated SMAD2/3, and degree of vasculopathy. We conclude that PD fluids activate arteriolar complement and TGF-β signaling, which quantitatively correlate with the severity of arteriolar vasculopathy.

Keywords: TGF-beta; arteriosclerosis; children; complement; peritoneal dialysis; vascular disease.


Figures

None
Graphical abstract
Figure 1.
Figure 1.
Cross-omics analysis of the complement pathway activation. Transcriptomic and proteomic analyses from adjacent sections of microdissected omental arterioles demonstrate (A) concordant activation of the IPA complement pathway and (B) correlation of complement-associated transcripts and proteins. Red shapes containing the gene symbols indicate upregulation, green symbols downregulation. In the correlation plot, black triangles represent direct members of the complement pathway; black round symbols represent gene symbols associated to the complement system in Panther, GO, and UniProt. The x axis gives mRNA expression ratios PD/CKD5, y axis respective protein ratios. The association between gene and protein ratios is highly significant when the transcriptomics outlier (CFB) is removed (P<0.01). (C) Analysis of abundance ratios for fragments of complement components as obtained from UniProt demonstrates activation on the level of biologically relevant fragments of complement components.
Figure 1.
Figure 1.
Cross-omics analysis of the complement pathway activation. Transcriptomic and proteomic analyses from adjacent sections of microdissected omental arterioles demonstrate (A) concordant activation of the IPA complement pathway and (B) correlation of complement-associated transcripts and proteins. Red shapes containing the gene symbols indicate upregulation, green symbols downregulation. In the correlation plot, black triangles represent direct members of the complement pathway; black round symbols represent gene symbols associated to the complement system in Panther, GO, and UniProt. The x axis gives mRNA expression ratios PD/CKD5, y axis respective protein ratios. The association between gene and protein ratios is highly significant when the transcriptomics outlier (CFB) is removed (P<0.01). (C) Analysis of abundance ratios for fragments of complement components as obtained from UniProt demonstrates activation on the level of biologically relevant fragments of complement components.
Figure 2.
Figure 2.
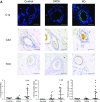
Parietal peritoneal arteriolar complement abundance. Representative immunostainings and quantification of C1q, C3d, and TCC in (A) omental and (B) parietal peritoneal arterioles of controls (n=5), patients with CKD5 (n=15), and patients on PD (n=15). Scale bars represent 100 µm. Immunofluorescence C1q staining was quantified by Image J, C3d, and TCC immunohistochemical stainings by Aperio. Individual data, median, and IQR are given. *P<0.05; **P<0.01; ***P<0.001 versus CKD5; #P<0.05; ##P<0.01 versus controls.
Figure 2.
Figure 2.
Parietal peritoneal arteriolar complement abundance. Representative immunostainings and quantification of C1q, C3d, and TCC in (A) omental and (B) parietal peritoneal arterioles of controls (n=5), patients with CKD5 (n=15), and patients on PD (n=15). Scale bars represent 100 µm. Immunofluorescence C1q staining was quantified by Image J, C3d, and TCC immunohistochemical stainings by Aperio. Individual data, median, and IQR are given. *P<0.05; **P<0.01; ***P<0.001 versus CKD5; #P<0.05; ##P<0.01 versus controls.
Figure 3.
Figure 3.
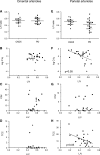
Peritoneal arteriolar complement activation and vasculopathy. (A) Omental and (E) parietal peritoneal arteriolar L/V ratio in children with CKD5 and on PD and correlation of complement factors C1q, C3D, and of TCC with L/V ratio, in (B–D) omental and (F–H) parietal peritoneal arterioles. In parietal peritoneal arterioles, C1q and TCC abundance inversely correlate with L/V ratio (rho=−0.44/r=−0.39, both P<0.05). Triangles represent children with CKD5, circles children on PD.
Figure 4.
Figure 4.
Dialytic glucose exposure and parietal peritoneal arteriolar complement activation. In parietal peritoneal arterioles, (A) C1q and (B) TCC abundance correlate with the glucose exposure of the peritoneum at the time of biopsy (rho=0.5/r=0.64, P<0.05/<0.01).
Figure 5.
Figure 5.
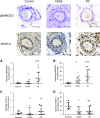
Peritoneal arteriolar pSMAD2/3 and VEGF-A. Representative immunostainings of pSMAD2/3 and VEGF-A in omental arterioles from children with normal renal function, CKD5, and on PD, respectively, are given in the upper part and quantification of arteriolar pSMAD2/3 and VEGF-A abundance in (A and C) omental and (B and D) parietal peritoneal arterioles in the lower part. Scale bars represent 100 µm. Individual data points, median, and IQR are given. * P<0.05, ** P<0.01 versus CKD5; # P<0.05; ## P<0.01 versus controls.
Figure 6.
Figure 6.
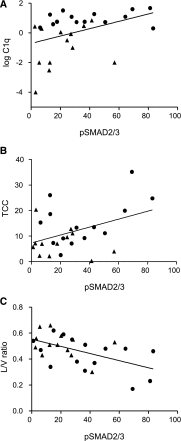
In parietal arterioles TGF-β–induced pSMAD2/3 abundance correlates with (A) C1q and (B) TCC (rho=0.5/r=0.41, P<0.01/P<0.05) and inversely correlates with (C) L/V ratio (r=−0.5, P<0.01). Triangles represent children with CKD5, circles children on PD.

References

    1. McDonald SP, Craig JC; Australian and New Zealand Paediatric Nephrology Association : Long-term survival of children with end-stage renal disease. N Engl J Med 350: 2654–2662, 2004 - PubMed
    1. Chesnaye N, Bonthuis M, Schaefer F, Groothoff JW, Verrina E, Heaf JG, Jankauskiene A, Lukosiene V, Molchanova EA, Mota C, Peco-Antić A, Ratsch IM, Bjerre A, Roussinov DL, Sukalo A, Topaloglu R, Van Hoeck K, Zagozdzon I, Jager KJ, Van Stralen KJ; ESPN/ERA–EDTA registry : Demographics of paediatric renal replacement therapy in Europe: A report of the ESPN/ERA-EDTA registry. Pediatr Nephrol 29: 2403–2410, 2014 - PubMed
    1. Oh J, Wunsch R, Turzer M, Bahner M, Raggi P, Querfeld U, Mehls O, Schaefer F: Advanced coronary and carotid arteriopathy in young adults with childhood-onset chronic renal failure. Circulation 106: 100–105, 2002 - PubMed
    1. de Jager DJ, Grootendorst DC, Jager KJ, van Dijk PC, Tomas LM, Ansell D, Collart F, Finne P, Heaf JG, De Meester J, Wetzels JF, Rosendaal FR, Dekker FW: Cardiovascular and noncardiovascular mortality among patients starting dialysis. JAMA 302: 1782–1789, 2009 - PubMed
    1. Kari JA, Donald AE, Vallance DT, Bruckdorfer KR, Leone A, Mullen MJ, Bunce T, Dorado B, Deanfield JE, Rees L: Physiology and biochemistry of endothelial function in children with chronic renal failure. Kidney Int 52: 468–472, 1997 - PubMed

Publication types

MeSH terms