. 2017 Nov 15;199(10):3700-3710.
doi: 10.4049/jimmunol.1700380. Epub 2017 Oct 18.

T Cell-Derived CD70 Delivers an Immune Checkpoint Function in Inflammatory T Cell Responses

Affiliations

T Cell-Derived CD70 Delivers an Immune Checkpoint Function in Inflammatory T Cell Responses

Rachel E O'Neill et al. J Immunol. .

Abstract

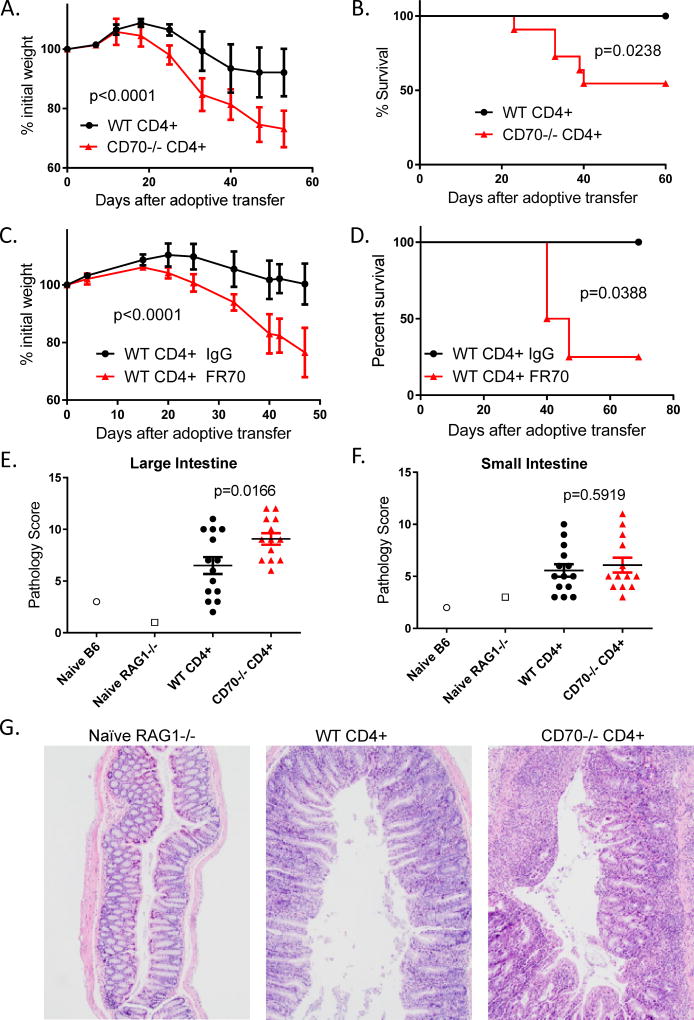
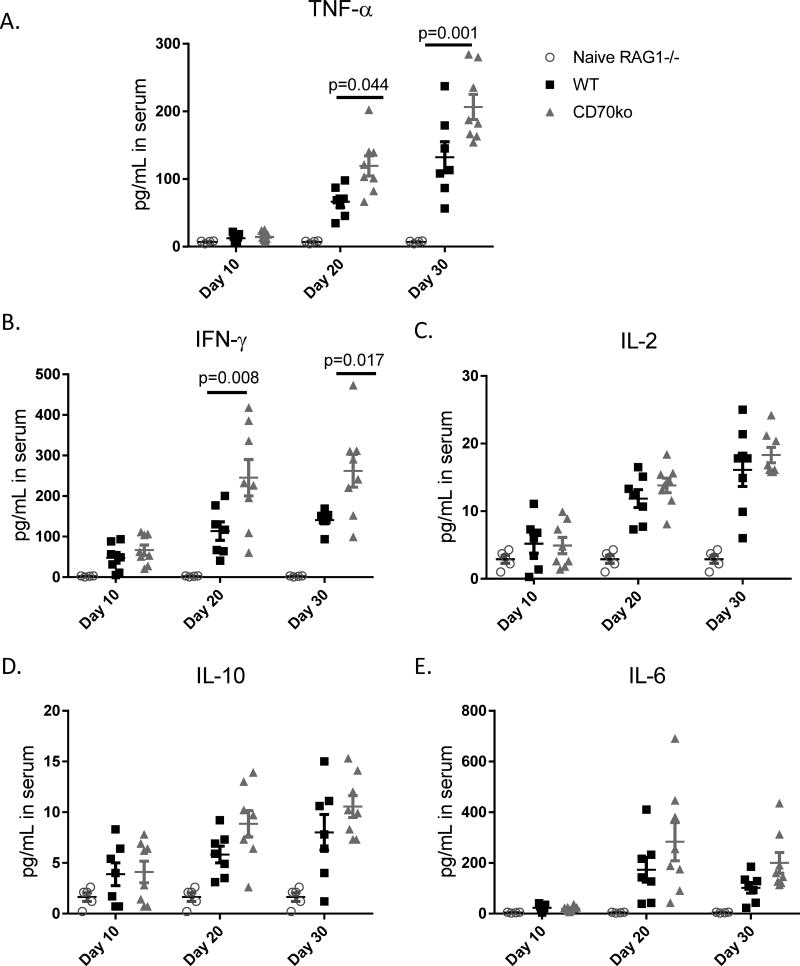
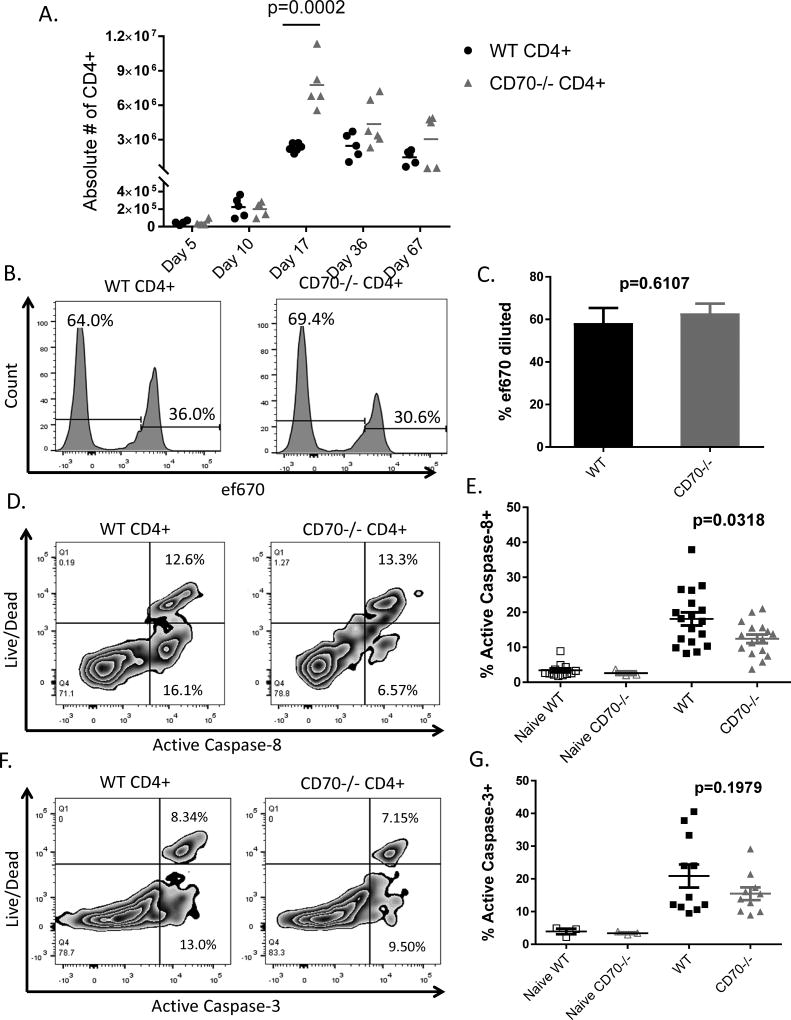
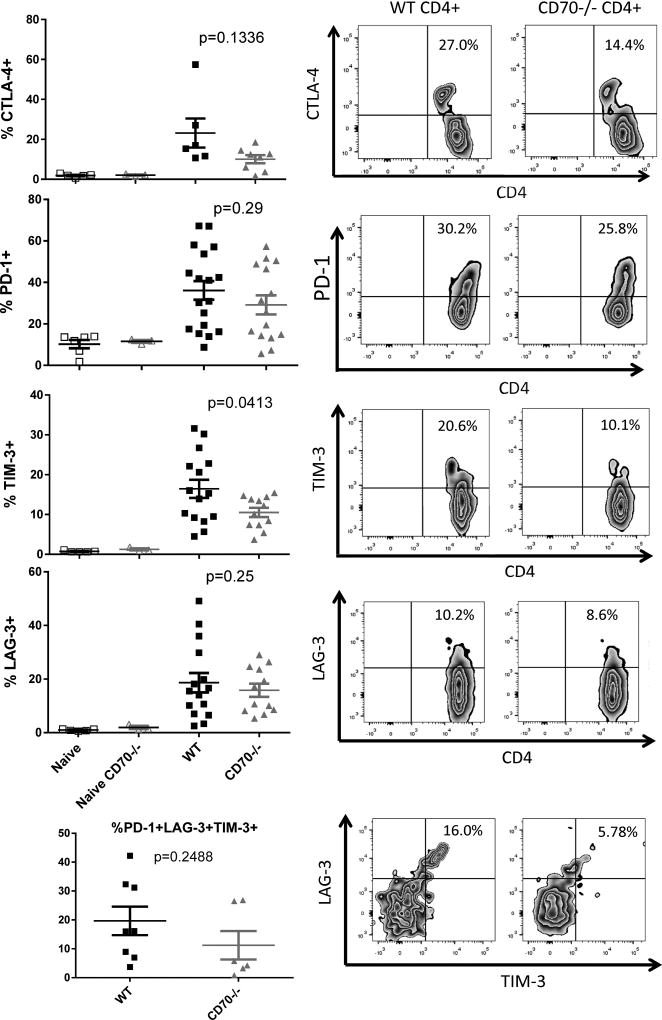
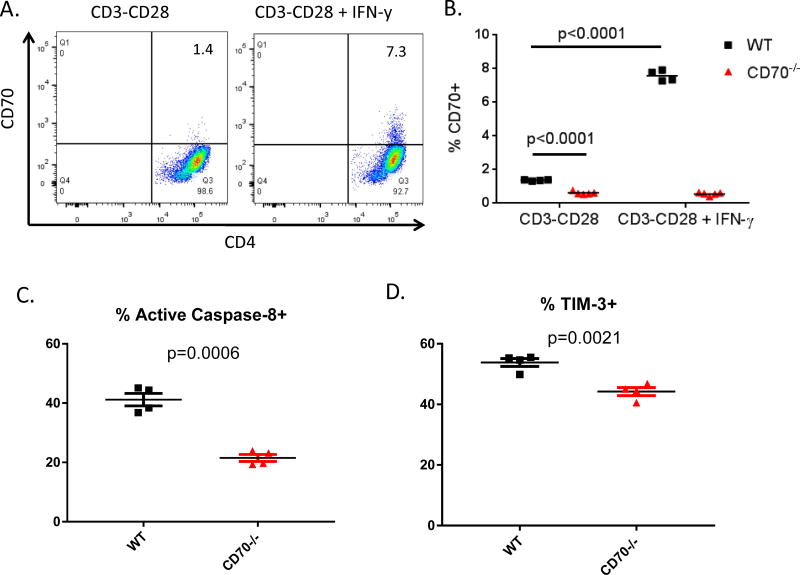
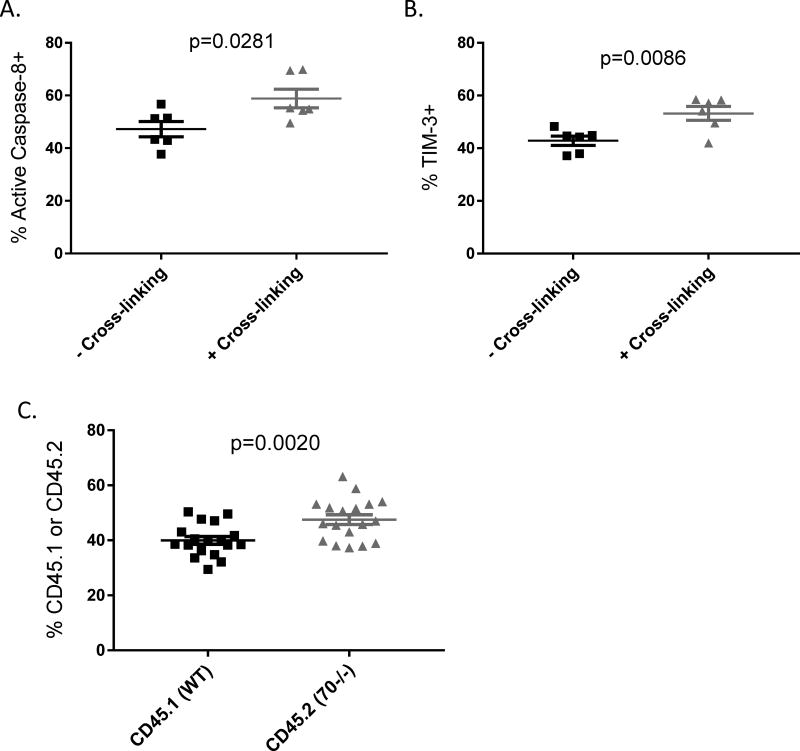
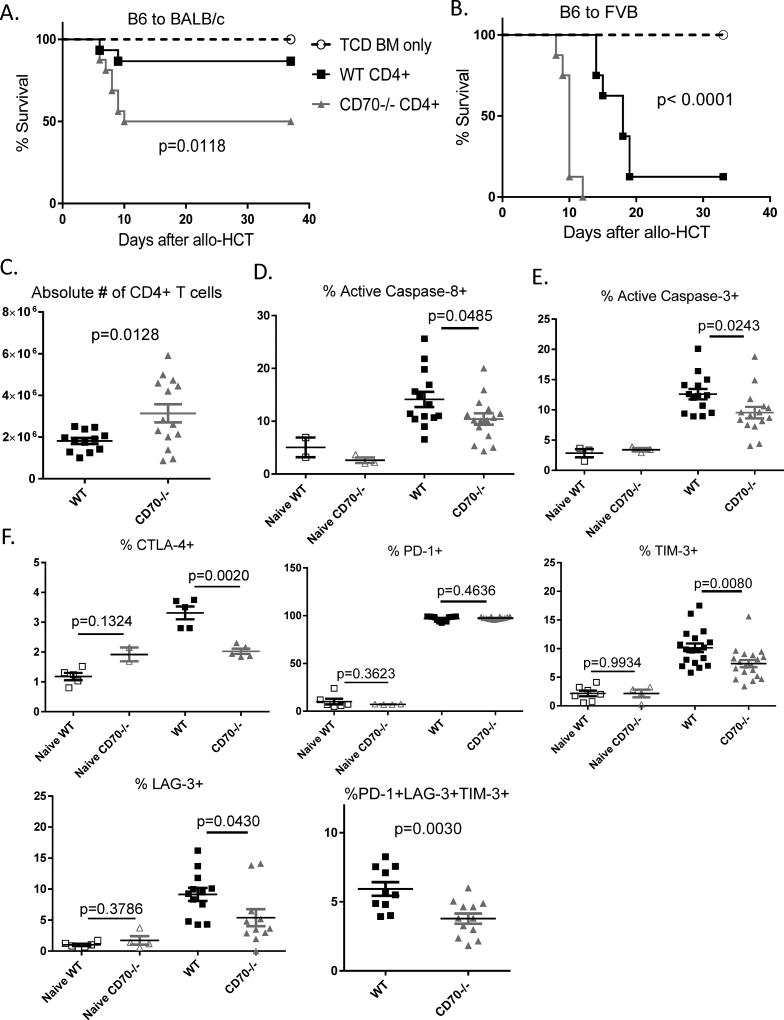
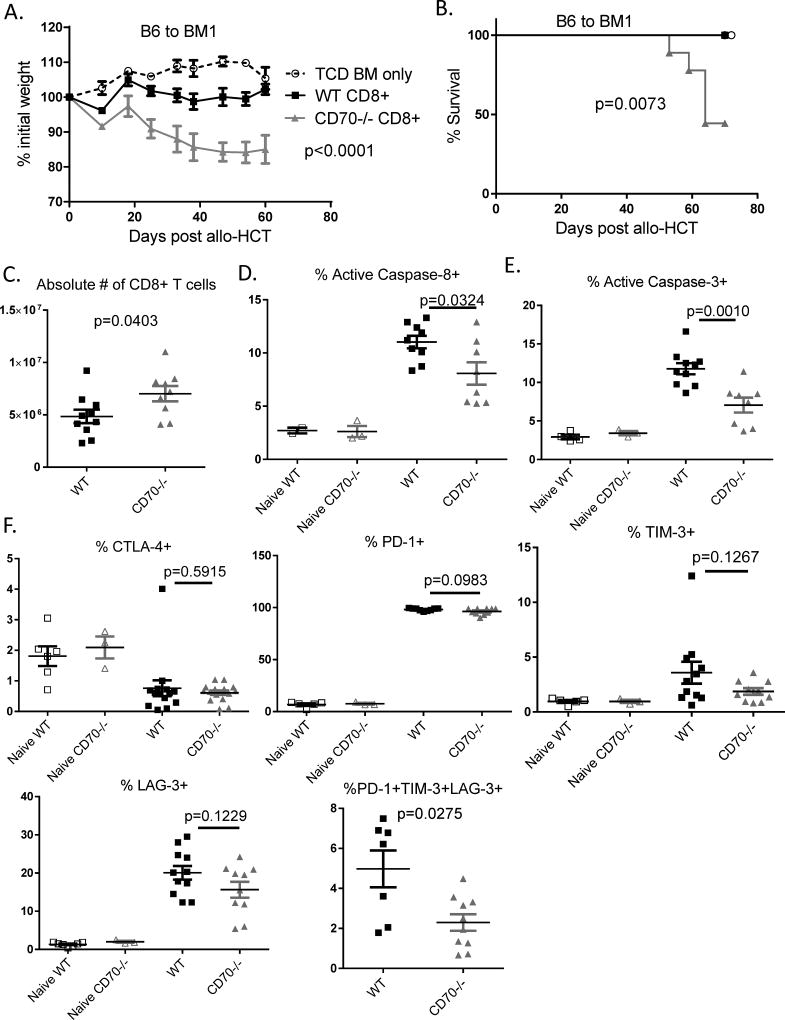
The CD27-CD70 pathway is known to provide a costimulatory signal, with CD70 expressed on APCs and CD27 functions on T cells. Although CD70 is also expressed on activated T cells, it remains unclear how T cell-derived CD70 affects T cell function. Therefore, we have assessed the role of T cell-derived CD70 using adoptive-transfer models, including autoimmune inflammatory bowel disease and allogeneic graft-versus-host disease. Surprisingly, compared with wild-type T cells, CD70-/- T cells caused more severe inflammatory bowel disease and graft-versus-host disease and produced higher levels of inflammatory cytokines. Mechanistic analyses reveal that IFN-γ induces CD70 expression in T cells, and CD70 limits T cell expansion via a regulatory T cell-independent mechanism that involves caspase-dependent T cell apoptosis and upregulation of inhibitory immune checkpoint molecules. Notably, T cell-intrinsic CD70 signaling contributes, as least in part, to the inhibitory checkpoint function. Overall, our findings demonstrate for the first time, to our knowledge, that T cell-derived CD70 plays a novel immune checkpoint role in inhibiting inflammatory T cell responses. This study suggests that T cell-derived CD70 performs a critical negative feedback function to downregulate inflammatory T cell responses.


Conflict of interest statement

Disclosure of Conflicts of Interest

The authors have no special/competing interests to disclose.

Figures

Figure 1
Figure 1. T cell-derived CD70 inhibits inflammatory bowel disease (IBD)
(A) Naïve RAG1−/− mice in the C57BL/6 strain background were injected with 1×10⁶ CD4+CD25 T cells purified from C57BL/6 WT or CD70−/− mice. Body weight was monitored after adoptive transfer. Representative weight data from 1 out of 3 independent experiments were shown as mean ± SD (n=4 per group), with statistical significance determined by two-way ANNOVA. (B) Kaplan-Meier survival data were summarized by combining 3 independent experiments (n=10–11 per group), with statistical significance determined by Log-rank test. (C-D) Naïve RAG1−/− mice were injected with 1×10⁶ CD4+CD25 T cells purified from C57BL/6 WT mice, and then treated from day 1 with 100ug of either CD70 antibody (FR70) or IgG control twice weekly for the duration of the experiment. (C) Body weight was shown as mean ± SD, with statistical significance determined by two-way ANNOVA. (D) Kaplan-Meier survival curves were shown with statistical significance determined using Log-rank test. (E-F) RAG1−/− host mice were sacrificed on days 17, 36 and 66. A blinded pathologist scored large (E) and small (F) intestines based on disease criteria outline in the Experimental Procedures. Summary scores combined from 3 independent experiments were shown, with statistical significance determined by unpaired student t test. (G) Representative histopathological images were shown for large intestine samples harvested from RAG1−/− host mice at day 36 after adoptive transfer.
Figure 2
Figure 2. T cell-derived CD70 decreases the levels of inflammatory cytokines
Naïve RAG1−/− mice in the C57BL/6 strain background were injected with 1×10⁶ CD4+CD25 T cells purified from C57BL/6 WT or CD70−/− mice. Serum samples were harvested via retro-orbital eye bleeding at days 10, 20 and 30 after adoptive transfer. Luminex assays were performed to measure the levels of the indicated cytokines. Each dot on the plots represents a single mouse at the indicated time points, with statistical significance determined by two-way ANNOVA.
Figure 3
Figure 3. T cell-derived CD70 suppresses T cell expansion by inducing caspase-dependent apoptosis
Naïve RAG1−/− mice in the C57BL/6 strain background were injected with 1×10⁶ CD4+CD25 T cells purified from C57BL/6 WT or CD70−/− mice. (A) Host mice were sacrificed at the indicated days after adoptive transfer. Absolute numbers of CD4+ T cells were calculated by multiplying the total numbers of spleen cells by the percentages of TCRβ+CD4+ T cells present in spleen samples determined by flow cytometry. (B–C) WT and CD70−/− CD4+CD25 T cells were stained with the cell proliferation dye ef670 and then injected into RAG1−/− host mice, which were then sacrificed at day 6 after adoptive transfer. TCRβ+CD4+ T cell proliferation was measured by ef670 dilution with data shown as mean ± SD (n=5 per group), with statistical significance determined by unpaired student t test. (D–G) Day 6 after adoptive transfer, host mice were sacrificed and spleen cells were analyzed by flow cytometry. TCRβ+CD4+ T cells were gated to examine a live/dead marker versus active caspase-8 or caspase-3. Cells positive for both live/dead and caspase, considered dead via apoptosis, and cells positive for only caspase, dying via apoptosis, were added to determine the percent of cells that activated Caspase-8 and −3 pathways for apoptosis. Shown are representative flow plot (D) and summary data (E) of caspase-8 activation. Also shown are representative flow plot (F) and summary data (G) of caspase-3 activation. Summary data are combined from 3 independent experiments. Each dot represents a single mouse, with statistical significance determined by unpaired student t test.
Figure 4
Figure 4. T cell-derived CD70 is associated with higher levels of checkpoint signals on T cells
Naïve RAG1−/− mice in the C57BL/6 strain background were injected with 1×10⁶ CD4+CD25 T cells purified from C57BL/6 WT or CD70−/− mice. Day 6 after adoptive transfer, host mice were sacrificed and spleens removed to analyze the expression of CTLA-4, PD-1, TIM-3, and LAG-3 by flow cytometry. Also analyzed are the purified CD4+CD25 T cells as pre-transplant controls. TCRβ+CD4+ T cells were gated to examine the percentages of cells that are positive for the indicated checkpoint signals. Statistical significance was determined by unpaired student t test.
Figure 5
Figure 5. IFN-γ stimulates T cell-derived CD70 expression and function
CD4+CD25 T cells were isolated from naïve C57BL/6 WT and CD70−/− mice and added with soluble anti-CD28 to a 48-well plate coated with anti-CD3 the day prior. 0.5×10⁶ T cells were added into each well in 0.5ml medium and treated with IFN-γ at 10ng/ml. After 48 hours T cells were harvested and analyzed by flow cytometry for CD70 expression. Shown are representative flow plots (A) and summary data (B) from 3 independent experiments with similar results. Statistical significance was determined by unpaired student t test. (C) TCRβ+CD4+ T cells were gated to examine a live/dead marker versus active caspase-8. Cells positive for both live/dead and caspase-8 were added to show the percent of cells that activated Caspase-8 pathway for apoptosis. (D) TCRβ+CD4+ T were gated to examine expression of TIM-3. Statistical significance was determined by unpaired student t test.
Figure 6
Figure 6. T cell intrinsic CD70 signaling contributes to the inhibitory checkpoint function
CD4+CD25 T cells were isolated from naïve C57BL/6 WT and CD70−/− mice and added with soluble anti-CD28 to a 48-well plate coated with anti-CD3 the day prior. 0.5×10⁶ T cells were added into each well in 0.5ml medium and treated with IFN-γ at 10ng/ml. 22 hours later the Rat anti-CD70 antibody was added at 5ug/ml to “cross-linking” wells and then 2 hours later a secondary anti-Rat antibody was added to all wells and incubated for another 24 hours. Cells were harvested and analyzed by flow cytometry for active caspase-8 (A) and TIM-3 expression (B). (C) Naïve RAG1−/− mice were injected with 0.5×10⁶ CD4+CD25 T cells purified from CD45.1 mice mixed with 0.5×10⁶ CD4+CD25 T cells from CD45.2 CD70−/− mice. Day 17 after adoptive transfer, spleens were harvested to analyze the percentages of CD45.1 versus CD45.2 cells in the gated TCRβ+CD4+ T cells. Statistical significance was determined by unpaired student t test.
Figure 7
Figure 7. T cell-derived CD70 inhibits allogeneic CD4+ T cell response
Lethally irradiated BALB/c or FVB hosts were transplanted with CD4+CD25 T cells purified from naïve C57BL/6 WT or CD70−/− mice. (A) Kaplan-Meier survival curves of BALB/c hosts injected with 2×10⁴ CD4+CD25 T cells and 3×10⁶ TCD BM. Data were summarized by combining 2 independent experiments (n=16 per group). (B) Kaplan-Meier survival curves of FVB hosts injected with 1×10⁶ CD4+CD25 T cells and 3.5×10⁶ TCD BM. Data were summarized by combining 2 independent experiments (n=8 per group). (A–B) Statistical significance was determined by Log-rank test. (C–F) Lethally irradiated BALB/c hosts were injected with 5×10⁵ CD4+CD25 T cells and 3×10⁶ TCD BM and sacrificed on Day 5. (C) Absolute numbers of CD4+ T cells were calculated by multiplying the total numbers of spleen cells by the percentages of TCRβ+CD4+ T cells present in spleen samples determined by flow cytometry. Summary data of caspase-8 activation (D) and caspase-3 activation (E) were combined from 3 independent experiments. (F) Summary data of CTLA-4, PD-1, TIM-3, and LAG-3 expression on TCRβ+CD4+ T cells at Day 5 after allo-HCT. Statistical significance was determined by unpaired student t test.
Figure 8
Figure 8. T cell-derived CD70 inhibits allogeneic CD8+ T cell response
Lethally irradiated BM1 or FVB hosts were transplanted with CD8+ T cells purified from naïve C57BL/6 WT or CD70−/− mice. (A) Body weight was monitored after BM1 hosts injected with 2×10⁶ CD8+ T cells and 3.5×10⁶ TCD BM. Representative data from 1 of 2 experiments is shown as mean ± SD (n=5 per group), with statistical significance determined by two-way ANNOVA. (B) Kaplan-Meier survival data of BM1 hosts are combined from 2 independent experiments (n=8–9 per group). Statistical significance was determined by Log-rank test. (C–F) FVB hosts injected with 1×10⁶ CD8+ T cells and 3×10⁶ TCD BM and sacrificed on Day 9 or 12. (C) Absolute numbers of CD8+ T cells were calculated by multiplying the total numbers of spleen cells by the percentages of TCRβ+CD8+ T cells present in spleen samples determined by flow cytometry on day 12. Summary data of caspase-8 activation (D) and caspase-3 activation (E) are combined from 3 independent experiments. (F) Summary data of CTLA-4, PD-1, TIM-3, LAG-3 expression on TCRβ+CD8+ T cells at Day 9 after allo-HCT. Statistical significance was determined by unpaired student t test.

References

    1. Chen L, Flies DB. Molecular mechanisms of T cell co-stimulation and co-inhibition. Nature reviews. Immunology. 2013;13:227–242. - PMC - PubMed
    1. Esensten JH, Helou YA, Chopra G, Weiss A, Bluestone JA. CD28 Costimulation: From Mechanism to Therapy. Immunity. 2016;44:973–988. - PMC - PubMed
    1. Watts TH. TNF/TNFR family members in costimulation of T cell responses. Annual review of immunology. 2005;23:23–68. - PubMed
    1. Sharma P, Allison JP. The future of immune checkpoint therapy. Science. 2015;348:56–61. - PubMed
    1. Freeman GJ, Long AJ, Iwai Y, Bourque K, Chernova T, Nishimura H, Fitz LJ, Malenkovich N, Okazaki T, Byrne MC, Horton HF, Fouser L, Carter L, Ling V, Bowman MR, Carreno BM, Collins M, Wood CR, Honjo T. Engagement of the PD-1 immunoinhibitory receptor by a novel B7 family member leads to negative regulation of lymphocyte activation. The Journal of experimental medicine. 2000;192:1027–1034. - PMC - PubMed

Publication types

MeSH terms