

In vivo staging of regional amyloid deposition
- PMID: 29046362
- PMCID: PMC5711511
- DOI: 10.1212/WNL.0000000000004643
In vivo staging of regional amyloid deposition
Abstract
Objectives: To estimate a regional progression pattern of amyloid deposition from cross-sectional amyloid-sensitive PET data and evaluate its potential for in vivo staging of an individual's amyloid pathology.
Methods: Multiregional analysis of florbetapir (18F-AV45)-PET data was used to determine individual amyloid distribution profiles in a sample of 667 participants from the Alzheimer's Disease Neuroimaging Initiative cohort, including cognitively normal older individuals (CN) as well as patients with mild cognitive impairment and Alzheimer disease (AD) dementia. The frequency of regional amyloid positivity across CN individuals was used to construct a 4-stage model of progressing amyloid pathology, and individual distribution profiles were used to evaluate the consistency of this hierarchical stage model across the full cohort.
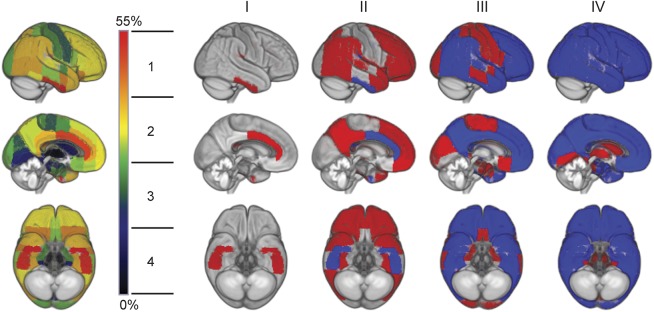
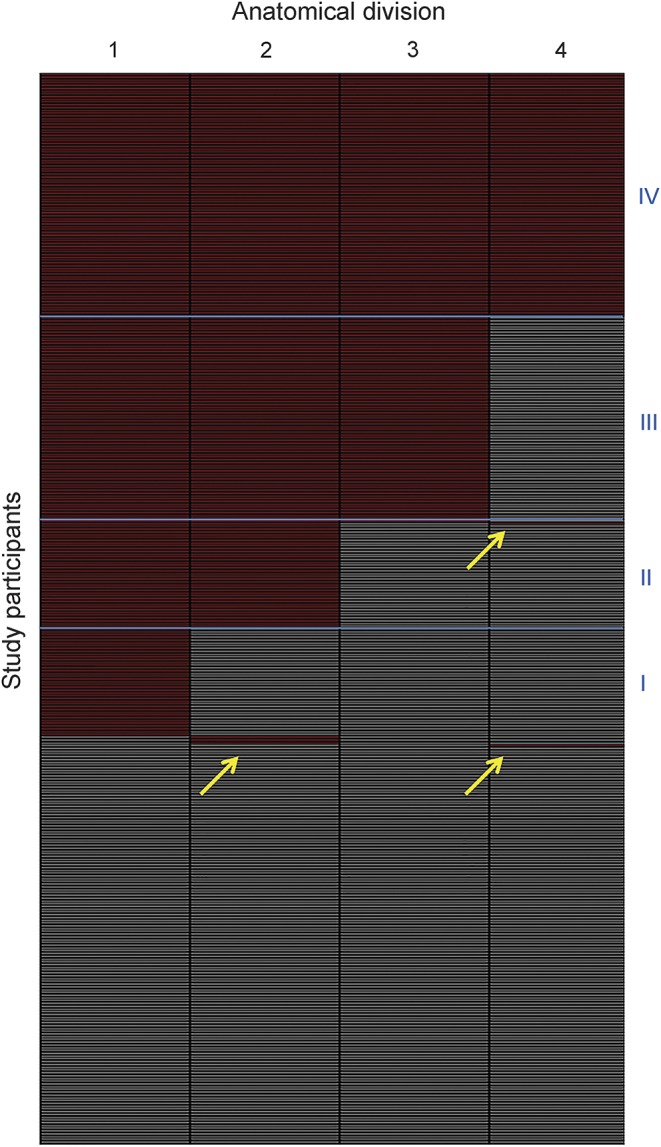
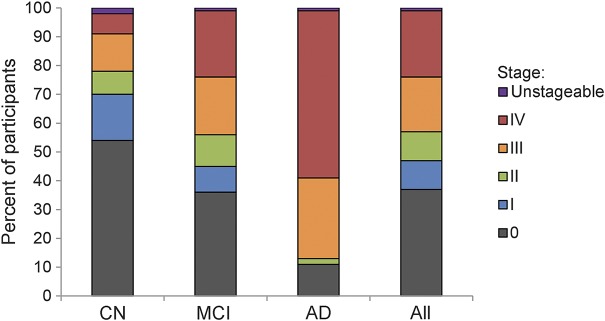
Results: According to a 4-stage model, amyloid deposition begins in temporobasal and frontomedial areas, and successively affects the remaining associative neocortex, primary sensory-motor areas and the medial temporal lobe, and finally the striatum. Amyloid deposition in these brain regions showed a highly consistent hierarchical nesting across participants, where only 2% exhibited distribution profiles that deviated from the staging scheme. The earliest in vivo amyloid stages were mostly missed by conventional dichotomous classification approaches based on global florbetapir-PET signal, but were associated with significantly reduced CSF Aβ42 levels. Advanced in vivo amyloid stages were most frequent in patients with AD and correlated with cognitive impairment in individuals without dementia.
Conclusions: The highly consistent regional hierarchy of PET-evidenced amyloid deposition across participants resembles neuropathologic observations and suggests a predictable regional sequence that may be used to stage an individual's progress of amyloid pathology in vivo.
Copyright © 2017 The Author(s). Published by Wolters Kluwer Health, Inc. on behalf of the American Academy of Neurology.
Figures
Comment in
-
Amyloid PET scan: Staging beyond reading?Neurology. 2017 Nov 14;89(20):2029-2030. doi: 10.1212/WNL.0000000000004678. Epub 2017 Oct 18. Neurology. 2017. PMID: 29046365 No abstract available.
References
-
- Braak H, Braak E. Neuropathological stageing of Alzheimer-related changes. Acta Neuropathol 1991;82:239–259. - PubMed
-
- Thal DR, Rub U, Orantes M, Braak H. Phases of A beta-deposition in the human brain and its relevance for the development of AD. Neurology 2002;58:1791–1800. - PubMed
-
- Price JL, Morris JC. Tangles and plaques in nondemented aging and “preclinical” Alzheimer's disease. Ann Neurol 1999;45:358–368. - PubMed
-
- Price JL, Davis PB, Morris JC, White DL. The distribution of tangles, plaques and related immunohistochemical markers in healthy aging and Alzheimer's disease. Neurobiol Aging 1991;12:295–312. - PubMed
MeSH terms
Substances
Grants and funding
LinkOut - more resources
Full Text Sources
Other Literature Sources
Medical