

Different contributions of primary motor cortex, reticular formation, and spinal cord to fractionated muscle activation
- PMID: 29046427
- PMCID: PMC5866475
- DOI: 10.1152/jn.00672.2017
Different contributions of primary motor cortex, reticular formation, and spinal cord to fractionated muscle activation
Abstract
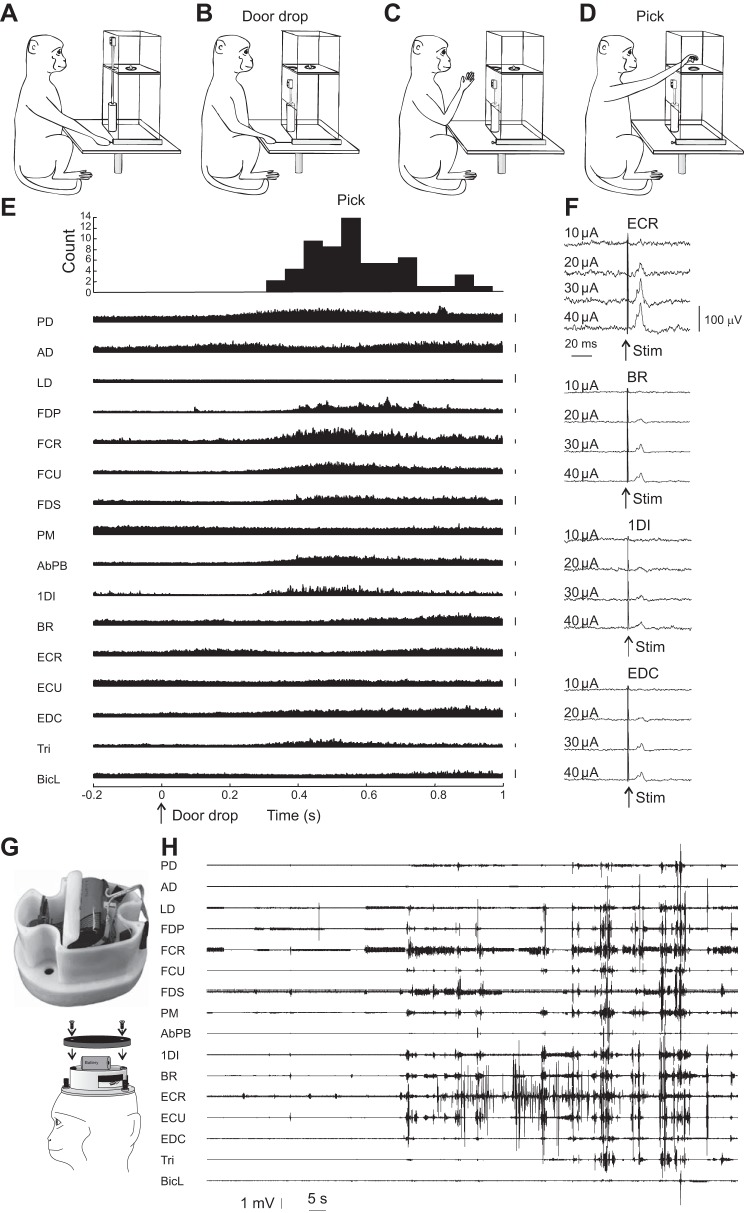
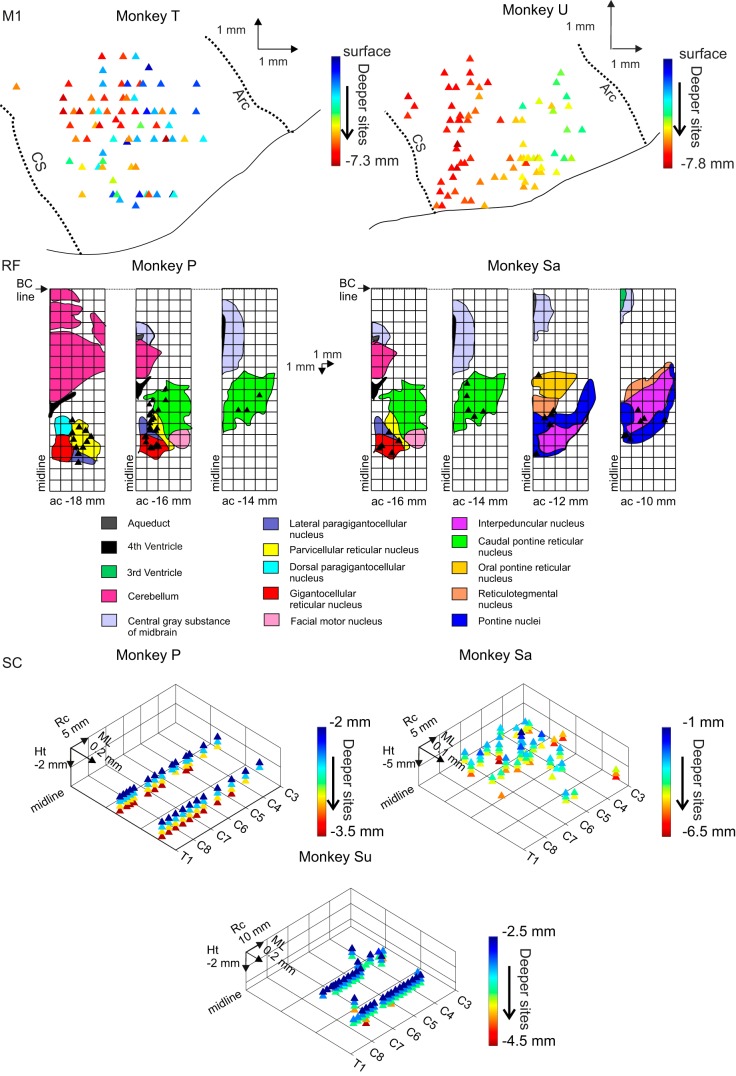
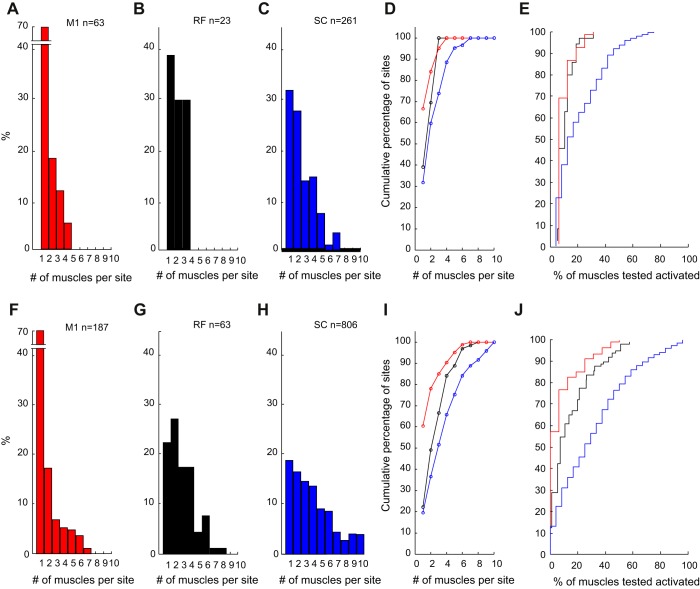
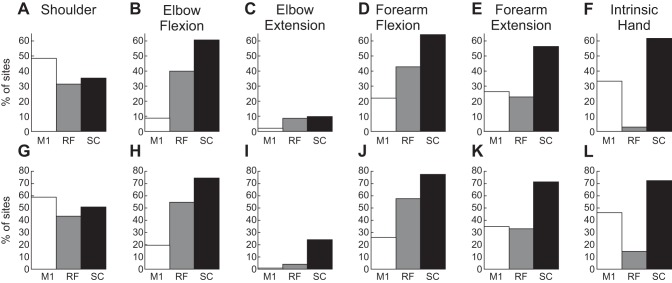
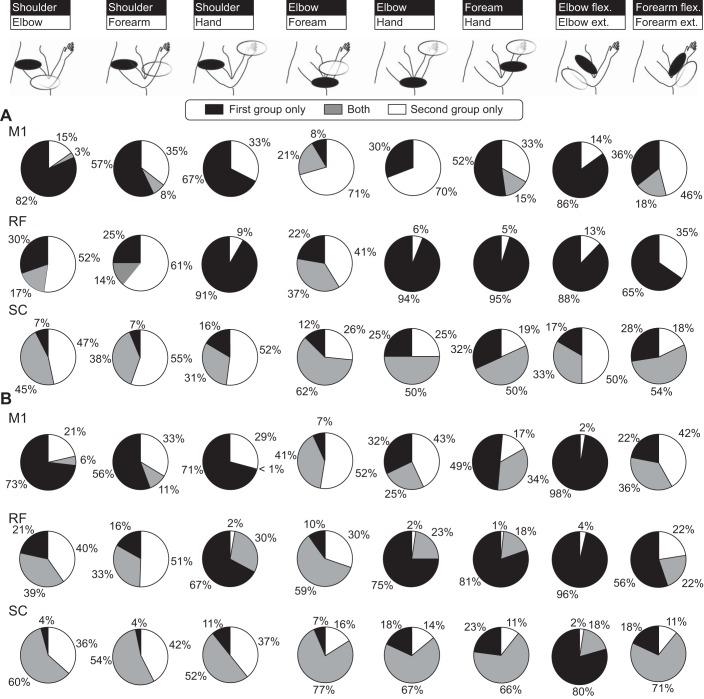
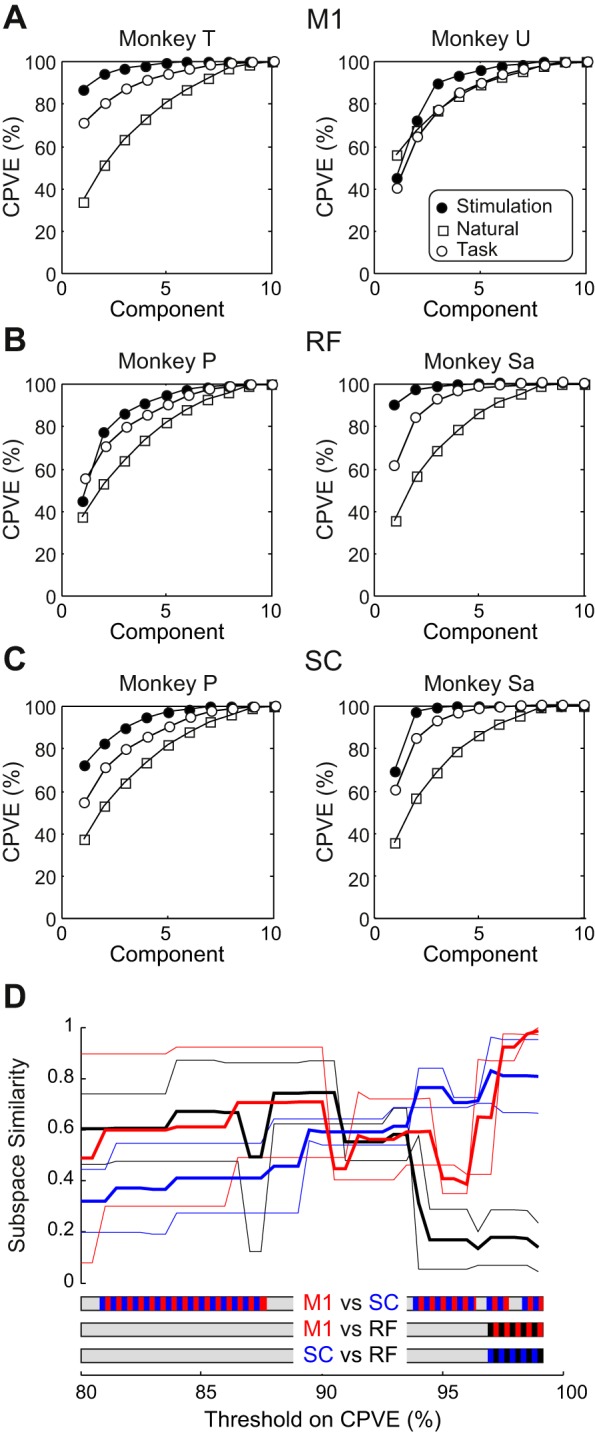
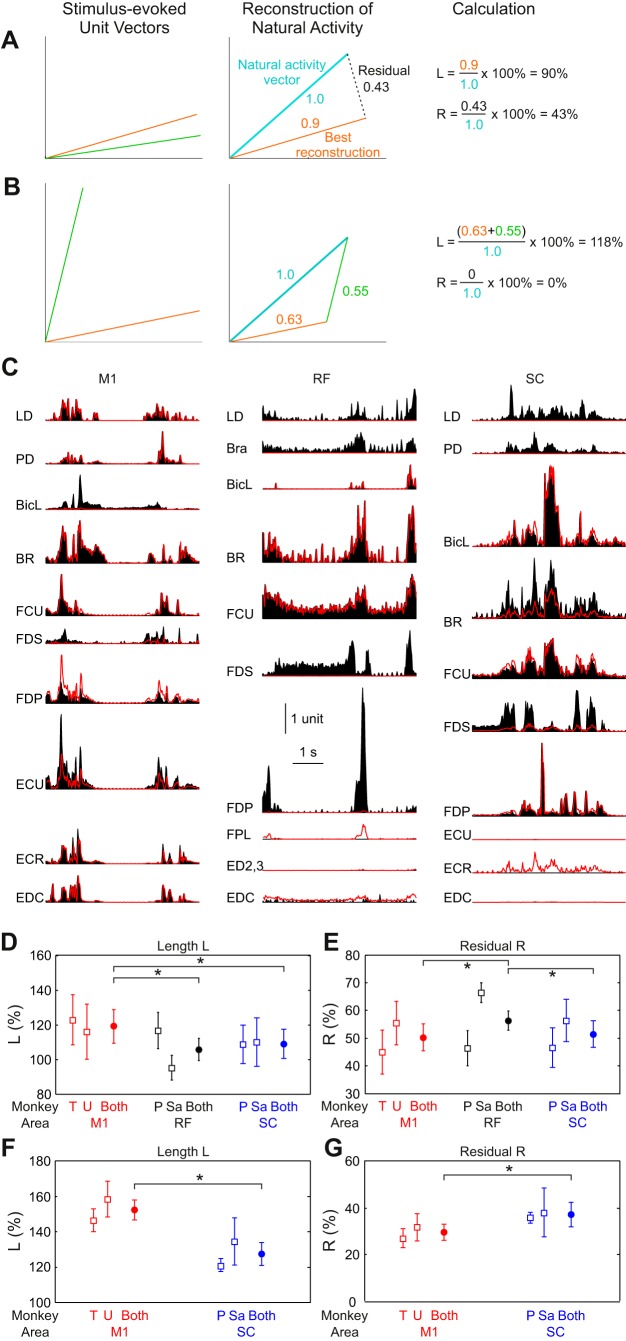
Coordinated movement requires patterned activation of muscles. In this study, we examined differences in selective activation of primate upper limb muscles by cortical and subcortical regions. Five macaque monkeys were trained to perform a reach and grasp task, and electromyogram (EMG) was recorded from 10 to 24 muscles while weak single-pulse stimuli were delivered through microelectrodes inserted in the motor cortex (M1), reticular formation (RF), or cervical spinal cord (SC). Stimulus intensity was adjusted to a level just above threshold. Stimulus-evoked effects were assessed from averages of rectified EMG. M1, RF, and SC activated 1.5 ± 0.9, 1.9 ± 0.8, and 2.5 ± 1.6 muscles per site (means ± SD); only M1 and SC differed significantly. In between recording sessions, natural muscle activity in the home cage was recorded using a miniature data logger. A novel analysis assessed how well natural activity could be reconstructed by stimulus-evoked responses. This provided two measures: normalized vector length L, reflecting how closely aligned natural and stimulus-evoked activity were, and normalized residual R, measuring the fraction of natural activity not reachable using stimulus-evoked patterns. Average values for M1, RF, and SC were L = 119.1 ± 9.6, 105.9 ± 6.2, and 109.3 ± 8.4% and R = 50.3 ± 4.9, 56.4 ± 3.5, and 51.5 ± 4.8%, respectively. RF was significantly different from M1 and SC on both measurements. RF is thus able to generate an approximation to the motor output with less activation than required by M1 and SC, but M1 and SC are more precise in reaching the exact activation pattern required. Cortical, brainstem, and spinal centers likely play distinct roles, as they cooperate to generate voluntary movements. NEW & NOTEWORTHY Brainstem reticular formation, primary motor cortex, and cervical spinal cord intermediate zone can all activate primate upper limb muscles. However, brainstem output is more efficient but less precise in producing natural patterns of motor output than motor cortex or spinal cord. We suggest that gross muscle synergies from the reticular formation are sculpted and refined by motor cortex and spinal circuits to reach the finely fractionated output characteristic of dexterous primate upper limb movements.
Keywords: electromyogram; fractionation; motor cortex; reticular formation; spinal cord; synergy.
Figures
Similar articles
-
Spinal interneuron circuits reduce approximately 10-Hz movement discontinuities by phase cancellation.Proc Natl Acad Sci U S A. 2010 Jun 15;107(24):11098-103. doi: 10.1073/pnas.0913373107. Epub 2010 Jun 1. Proc Natl Acad Sci U S A. 2010. PMID: 20534484 Free PMC article.
-
Extensive Cortical Convergence to Primate Reticulospinal Pathways.J Neurosci. 2021 Feb 3;41(5):1005-1018. doi: 10.1523/JNEUROSCI.1379-20.2020. Epub 2020 Dec 2. J Neurosci. 2021. PMID: 33268548 Free PMC article.
-
Arm-movement-related neurons in the primate superior colliculus and underlying reticular formation: comparison of neuronal activity with EMGs of muscles of the shoulder, arm and trunk during reaching.Exp Brain Res. 1997 Jun;115(2):191-205. doi: 10.1007/pl00005690. Exp Brain Res. 1997. PMID: 9224849
-
Cortical and brainstem control of locomotion.Prog Brain Res. 2004;143:251-61. doi: 10.1016/S0079-6123(03)43025-2. Prog Brain Res. 2004. PMID: 14653170 Review.
-
The reorganization of the motor system in primates after the loss of a limb.Restor Neurol Neurosci. 2004;22(3-5):145-52. Restor Neurol Neurosci. 2004. PMID: 15502261 Review.
Cited by
-
Evolution, biomechanics, and neurobiology converge to explain selective finger motor control.Physiol Rev. 2024 Jul 1;104(3):983-1020. doi: 10.1152/physrev.00030.2023. Epub 2024 Feb 22. Physiol Rev. 2024. PMID: 38385888 Free PMC article. Review.
-
Changes of motor corticobulbar projections following different lesion types affecting the central nervous system in adult macaque monkeys.Eur J Neurosci. 2018 Aug;48(4):2050-2070. doi: 10.1111/ejn.14074. Epub 2018 Aug 16. Eur J Neurosci. 2018. PMID: 30019432 Free PMC article.
-
Startling stimuli increase maximal motor unit discharge rate and rate of force development in humans.J Neurophysiol. 2022 Sep 1;128(3):455-469. doi: 10.1152/jn.00115.2022. Epub 2022 Jul 13. J Neurophysiol. 2022. PMID: 35829632 Free PMC article.
-
Predicting the Response to Non-invasive Brain Stimulation in Stroke.Front Neurol. 2019 Apr 2;10:302. doi: 10.3389/fneur.2019.00302. eCollection 2019. Front Neurol. 2019. PMID: 31001190 Free PMC article. No abstract available.
-
A Novel Wearable Device for Motor Recovery of Hand Function in Chronic Stroke Survivors.Neurorehabil Neural Repair. 2020 Jul;34(7):600-608. doi: 10.1177/1545968320926162. Epub 2020 May 26. Neurorehabil Neural Repair. 2020. PMID: 32452275 Free PMC article. Clinical Trial.
References
-
- Baker SN, Lemon RN. Computer simulation of post-spike facilitation in spike-triggered averages of rectified EMG. J Neurophysiol 80: 1391–1406, 1998. - PubMed
Publication types
MeSH terms
Grants and funding
LinkOut - more resources
Full Text Sources
Other Literature Sources