. 2017 Oct 18;9(412):eaan5689.
doi: 10.1126/scitranslmed.aan5689.

ALK is a therapeutic target for lethal sepsis

Affiliations

ALK is a therapeutic target for lethal sepsis

Ling Zeng et al. Sci Transl Med. .

Erratum in

Abstract

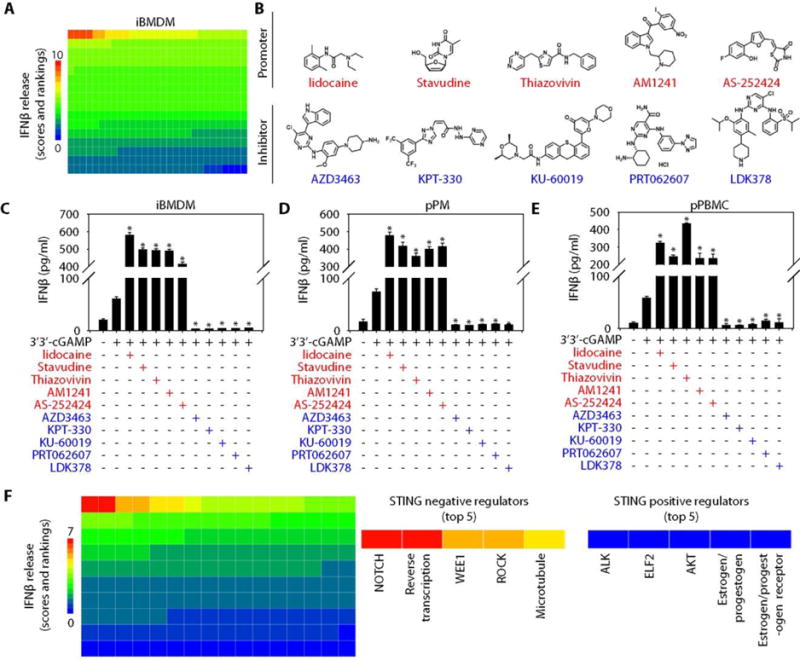
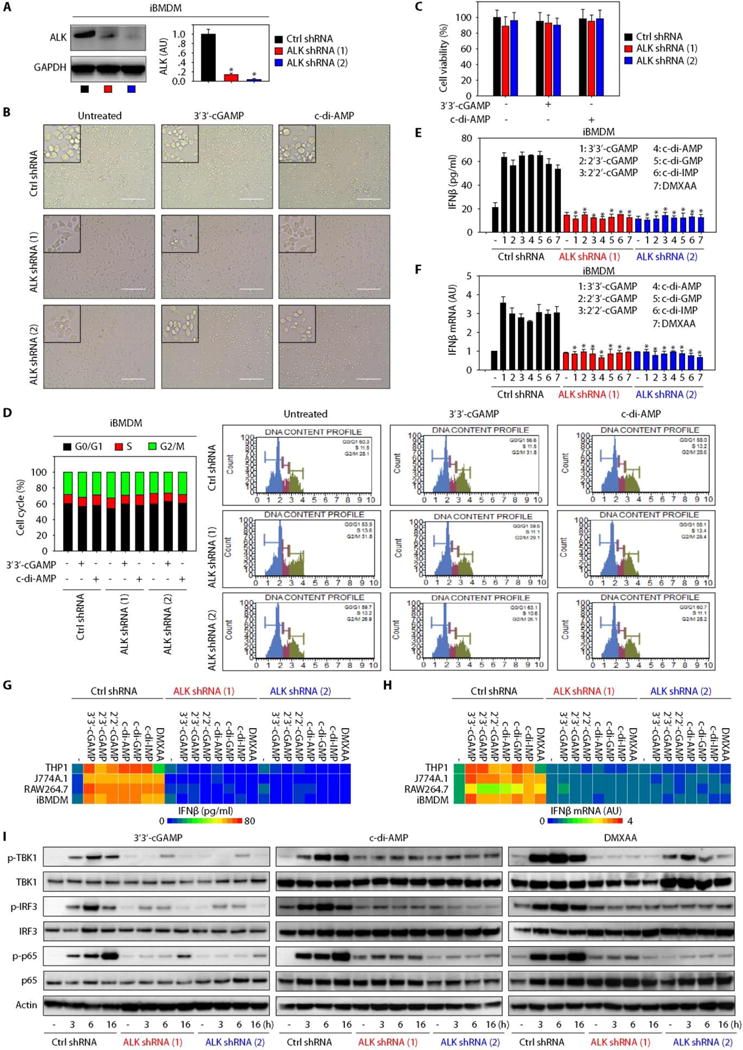
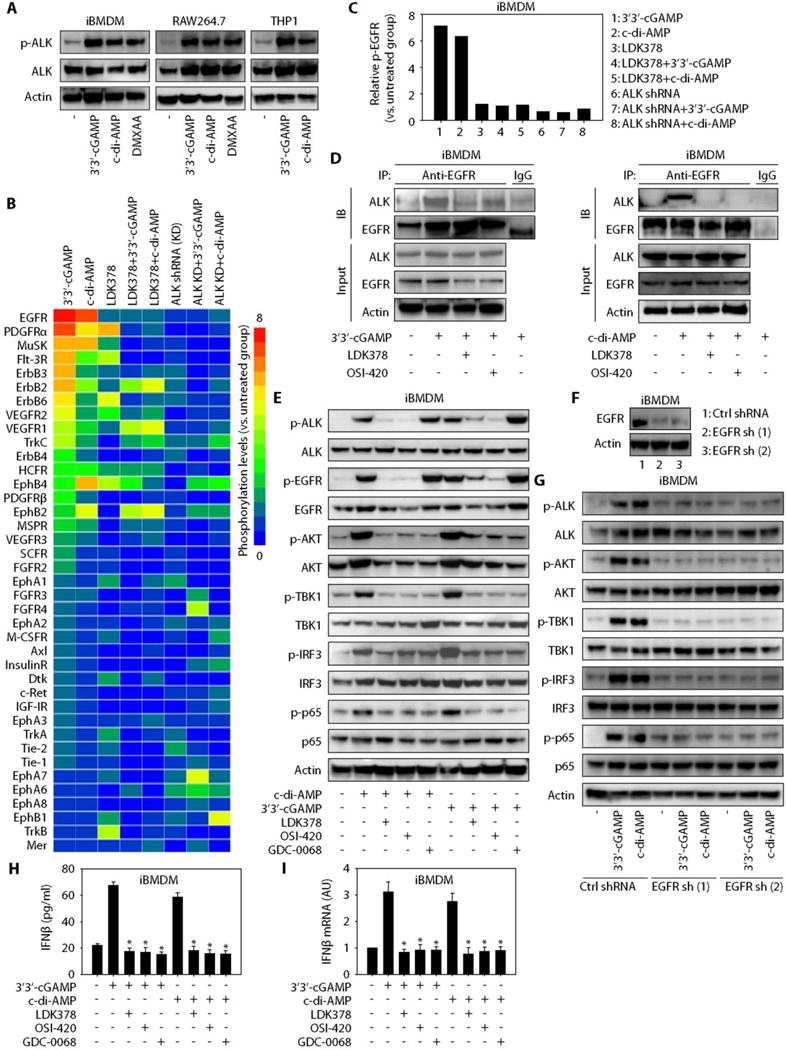
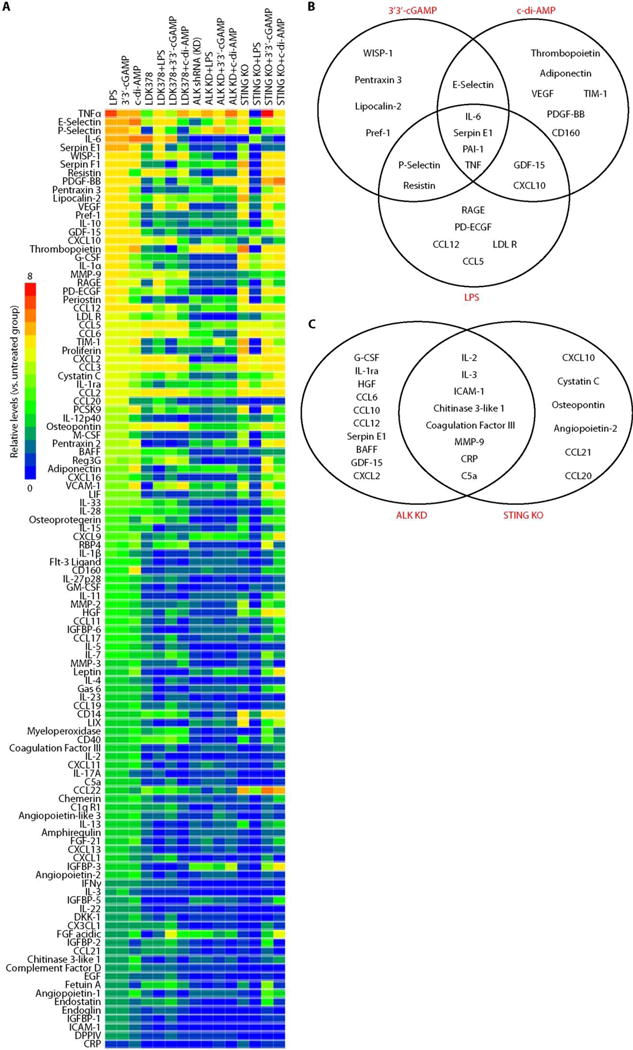
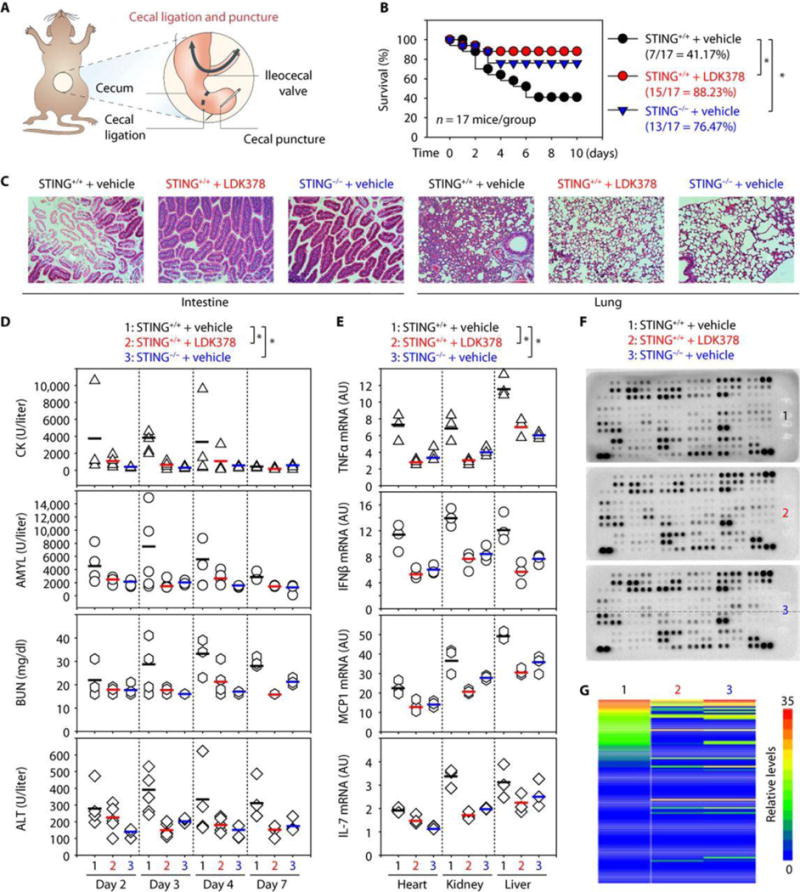
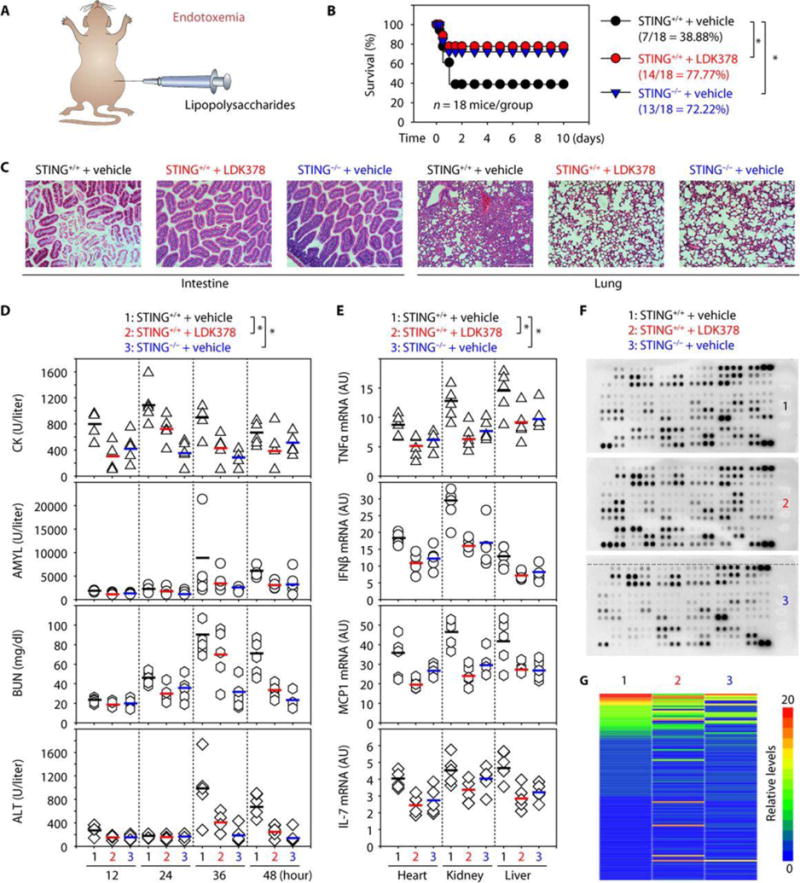
Sepsis, a life-threatening organ dysfunction caused by infection, is a major public health concern with limited therapeutic options. We provide evidence to support a role for anaplastic lymphoma kinase (ALK), a tumor-associated receptor tyrosine kinase, in the regulation of innate immunity during lethal sepsis. The genetic disruption of ALK expression diminishes the stimulator of interferon genes (STING)-mediated host immune response to cyclic dinucleotides in monocytes and macrophages. Mechanistically, ALK directly interacts with epidermal growth factor receptor (EGFR) to trigger serine-threonine protein kinase AKT phosphorylation and activate interferon regulatory factor 3 (IRF3) and nuclear factor κB (NF-κB) signaling pathways, enabling STING-dependent rigorous inflammatory responses. Moreover, pharmacological or genetic inhibition of the ALK-STING pathway confers protection against lethal endotoxemia and sepsis in mice. The ALK pathway is up-regulated in patients with sepsis. These findings uncover a key role for ALK in modulating the inflammatory signaling pathway and shed light on the development of ALK-targeting therapeutics for lethal systemic inflammatory disorders.


Conflict of interest statement

Competing interests: No potential conflicts of interest were disclosed.

Figures

Fig. 1
Fig. 1. Identification of bioactive compounds modulating STING activation
(A) Heatmap of STING activity changes based on IFNβ release from iBMDMs after 3′3′-cGAMP (10 μg/ml, 16 hours) stimulation in the absence or presence of 464 bioactive compounds (10 μM). (B) Structure of the compound identified to inhibit (blue) or promote (red) STING activity. (C to E) IFNβ release assayed using enzyme-linked immunosorbent assay (ELISA) from iBMDMs (C), pPMs (D), and pPBMCs (E) treated with 3′3′-cGAMP (10 μg/ml) in the absence or presence of indicated bioactive compounds (10 μM) for 16 hours [n = 3; data are means ± SD; *P < 0.05 versus 3′3′-cGAMP group, analysis of variance (ANOVA) least significant difference (LSD) test]. (F) Heatmap of STING activity changes as judged by IFNβ release from iBMDMs after 3′3′-cGAMP (10 μg/ml, 16 hours) stimulation in the absence or presence of 174 signaling modulating compounds. The top five negative (inhibitory) and positive (agonistic) regulators are noted.
Fig. 2
Fig. 2. Pharmacologic inhibition of ALK impairs STING activation.
(A) iBMDMs were stimulated with indicated STING ligands (10 μg/ml) in the absence or presence of LDK378 (10 μM), AP26113 (10 μM), or control vehicle [dimethyl sulfoxide (DMSO)] for 16 hours, and the release of IFNβ was assayed using ELISA (n = 3; data are means ± SD; *P < 0.05 versus DMSO group, ANOVA LSD test). (B) Heatmap of IFNβ release changes in macrophages or monocytes after STING ligand (10 μg/ml) stimulation in combination with LDK378 (10 μM), AP26113 (10 μM), or vehicle (DMSO) for 16 hours. (C) iBMDMs were stimulated with indicated STING ligands (10 μg/ml) in the absence or presence of LDK378 (10 μM), AP26113 (10 μM), or vehicle (DMSO) for 16 hours, and IFNβ mRNA was assayed with quantitative polymerase chain reaction (n = 3; data are means ± SD; *P < 0.05 versus DMSO group, ANOVA LSD test). (D) Heatmap of IFNβ mRNA changes in macrophages or monocytes after STING ligand (10 μg/ml) stimulation in combination with LDK378 (10 μM), AP26113 (10 μM), or vehicle (DMSO) for 16 hours. AU, arbitrary units. (E and F) Western blot analysis of indicated protein expression in iBMDMs (E) or J774A.1 cells (F) after 3′3′-cGAMP (10 μg/ml) stimulation in combination with LDK378 (10 μM), AP26113 (10 μM), or vehicle (DMSO) for 3 to 16 hours. (G and H) Western blot analysis of indicated protein expression in iBMDMs (G) or J774A.1 cells (H) after c-di-AMP (10 μg/ml) or DMXAA (10 μg/ml) stimulation in combination with LDK378 (10 μM), AP26113 (10 μM), or vehicle (DMSO) for 16 hours.
Fig. 3
Fig. 3. Genetic silencing of ALK limits STING activation
(A) Western blot analysis of ALK expression in ALK stable knockdown iBMDMs (n = 3; data are means ± SD; *P < 0.05 versus control shRNA group, t test). GAPDH, glyceraldehyde-3-phosphate dehydrogenase. (B to D) Indicated iBMDMs were stimulated with 3′3′-cGAMP (10 μg/ml) or c-di-AMP (10 μg/ml) for 16 hours, and cell morphology (B), viability (C), and cell cycle phase (D) were assayed (scale bars, 200 μm). (E and F) Indicated iBMDMs were stimulated with indicated STING ligands (10 μg/ml) for 16 hours, and IFNβ protein release (E) and IFNβ mRNA (F) were assayed [n = 3; data are means ± SD; *P < 0.05 versus control (Ctrl) shRNA group, ANOVA LSD test]. (G and H) Heatmap of IFNβ protein release (G) and IFNβ mRNA expression (H) changes in indicated ALK-WT (wild-type) and ALK-knockdown macrophages or monocytes after STING ligand (10 μg/ml) stimulation for 16 hours. (I) Western blot analysis of indicated protein expression in ALK-WT and ALK-knockdown iBMDMs after stimulation with 3′3′-cGAMP (10 μg/ml), c-di-AMP (10 μg/ml), or DMXAA (10 μg/ml) for 16 hours.
Fig. 4
Fig. 4. ALK/EGFR binding triggers AKT-dependent STING activation
(A) Western blot analysis of indicated protein expression in iBMDMs and RAW264.7 and THP1 cells after stimulation with 3′3′-cGAMP (10 μg/ml), c-di-AMP (10 μg/ml), or DMXAA (10 μg/ml) for 16 hours. (B) Heatmap of RTKs phosphorylation changes in iBMDMs after 3′3′-cGAMP (10 μg/ml) or c-di-AMP (10 μg/ml) stimulation for 16 hours with or without pharmacologic (LDK378, 10 μM) or genetic inhibition of ALK. (C) Relative EGFR phosphorylation assayed in parallel to (B). (D) Immunoprecipitation (IP) analysis of the interaction between ALK and EGFR in iBMDMs after 3′3′-cGAMP (10 μg/ml) or c-di-AMP (10 μg/ml) stimulation for 16 hours with or without LDK378 (10 μM) or OSI-420 (10 μM). IB, immunoblotting. (E) Western blot analysis of indicated protein expression in iBMDMs after treatment with 3′3′-cGAMP (10 μg/ml) or c-di-AMP (10 μg/ml) for 16 hours with or without LDK378 (10 μM), OSI-420 (10 μM), or GDC-0068 (10 μM). (F) Western blot analysis of EGFR expression in EGFR stable knockdown iBMDMs. (G) Western blot analysis of indicated protein expression in EGFR-WT and EGFR-knockdown iBMDMs after stimulation with 3′3′-cGAMP (10 μg/ml) or c-di-AMP (10 μg/ml) for 16 hours. (H and I) iBMDMs were treated with 3′3′-cGAMP (10 μg/ml) or c-di-AMP (10 μg/ml) for 16 hours with or without LDK378 (10 μM), OSI-420 (10 μM), or GDC-0068 (10 μM), and IFNβ protein release (H) and IFNβ mRNA expression (I) were assayed (n = 3; data are means ± SD; *P < 0.05 versus 3′3′-cGAMP or c-di-AMP group, ANOVA LSD test).
Fig. 5
Fig. 5. ALK and STING have overlapping and distinct immune functions in immune chemical release
(A) Heatmap of immune chemical profile in wild type (WT), ALK-knockdown (KD), or STING-knockout (KO) iBMDMs after stimulation with LPS (1 μg/ml), 3′3′-cGAMP (10 μg/ml), or c-di-AMP (10 μg/ml) for 16 hours with or without LDK378 (10 μM). (B) Changes in immune chemical release in WT iBMDMs after LPS, 3′3′-cGAMP, and c-di-AMP treatment. (C) Changes in immune chemical release between ALK-KD and STING-KO iBMDMs in response to 3′3′-cGAMP, c-di-AMP, or LPS.
Fig. 6
Fig. 6. Inhibition of the ALK-STING pathway protects mice against CLP-induced polymicrobial sepsis
(A) Schematic depiction of the CLP model. (B) Administration of LDK378 or depletion of STING in mice prevented CLP (22-gauge needle)–induced animal death (n = 17 mice per group; *P < 0.05, Kaplan-Meier survival analysis). (C to G) In parallel, tissue hematoxylin and eosin staining (day 3; scale bars, 200 μm) (C), serum enzyme activity (days 2 to 7) (D), cytokine mRNA (day 3) (E), serum antibody array (day 3) (F), and heatmap of immune chemical profile (day 3) (G) were assayed (n = 3 to 5 mice per group; each bar represents the mean of the data; *P< 0.05, ANOVA LSD test). The top five down-regulated circulating immune chemical mediators in LDK378 and STING−/− groups compared with control group included IL-10, serpin E1, serpin F1, TIM-1, and CXCL2. High-resolution images related to (C), (F), and (G) are shown in figs. S12 and S13.
Fig. 7
Fig. 7. Inhibition of the ALK-STING pathway protects mice against LPS-induced endotoxemia
(A) Schematic depicting the endotoxemia model. (B) Administration of LDK378 or depletion of STING in mice prevented LPS (10 mg/kg)–induced animal death (n = 18 mice per group; *P < 0.05, Kaplan-Meier survival analysis). (C to G) In parallel, tissue hematoxylin and eosin staining (24 hours; scale bars, 200 μm) (C), serum enzyme activity (12 to 48 hours) (D), cytokine mRNA (24 hours) (E), serum antibody array (24 hours) (F), and heatmap of immune chemical profile (24 hours) (G) were assayed (n = 3 to 5 mice per group; each bar represents the mean of the data; *P < 0.05, ANOVA LSD test). The top five down-regulated circulating immune chemical mediators in LDK378 and STING−/− groups compared with control group included EGF, CD14, CXCL1, endoglin, and CCL22. High-resolution images related to (C), (F), and (G) are shown in figs. S14 and S15.
Fig. 8
Fig. 8. Gene and protein changes in ALK-dependent STING pathways in human sepsis
(A) Box plots comparing measures of ALK, EGFR, STING, TBK1, and IRF3 mRNA in PBMC samples of sepsis patients (n=16) and healthy controls (n=10). The mRNA are presented as median value (black line), interquartile range (box), and minimum and maximum of all data (black line). *, P<0.05 versus control group, t test. (B) Table depicting clinical characteristics of sepsis patients and healthy control individuals. (C) Western blot analysis of indicated protein expression in PBMC samples of sepsis patients and healthy controls.

Comment in

References

    1. Angus DC, van der Poll T. Severe sepsis and septic shock. N Engl J Med. 2013;369:840–851. - PubMed
    1. Vincent JL, Opal SM, Marshall JC, Tracey KJ. Sepsis definitions: time for change. Lancet. 2013;381:774–775. - PMC - PubMed
    1. Singer M, Deutschman CS, Seymour CW, Shankar-Hari M, Annane D, Bauer M, Bellomo R, Bernard GR, Chiche JD, Coopersmith CM, Hotchkiss RS, Levy MM, Marshall JC, Martin GS, Opal SM, Rubenfeld GD, van der Poll T, Vincent JL, Angus DC. The Third International Consensus Definitions for Sepsis and Septic Shock (Sepsis-3) JAMA. 2016;315:801–810. - PMC - PubMed
    1. Broz P, Monack DM. Newly described pattern recognition receptors team up against intracellular pathogens. Nat Rev Immunol. 2013;13:551–565. - PubMed
    1. Hotchkiss RS, Monneret G, Payen D. Sepsis-induced immunosuppression: from cellular dysfunctions to immunotherapy. Nat Rev Immunol. 2013;13:862–874. - PMC - PubMed

MeSH terms