

Modulation of Global Transcriptional Regulatory Networks as a Strategy for Increasing Kanamycin Resistance of the Translational Elongation Factor-G Mutants in Escherichia coli
- PMID: 29046437
- PMCID: PMC5714492
- DOI: 10.1534/g3.117.300284
Modulation of Global Transcriptional Regulatory Networks as a Strategy for Increasing Kanamycin Resistance of the Translational Elongation Factor-G Mutants in Escherichia coli
Abstract
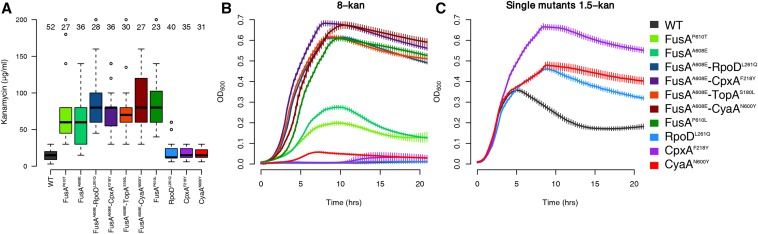
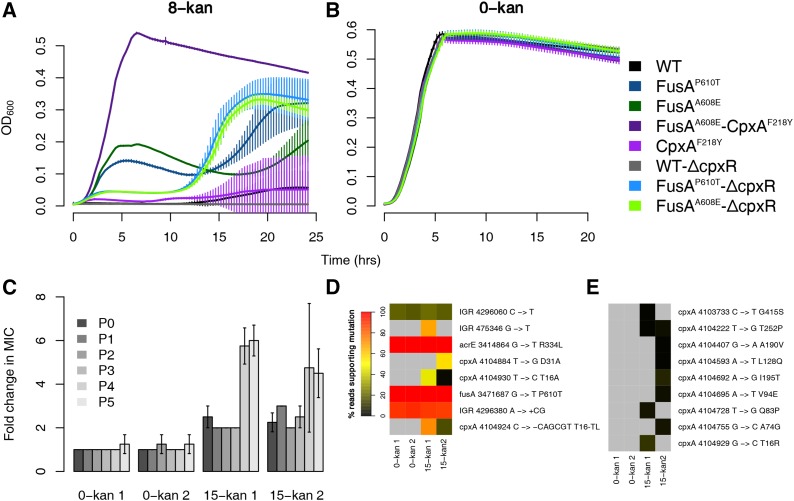
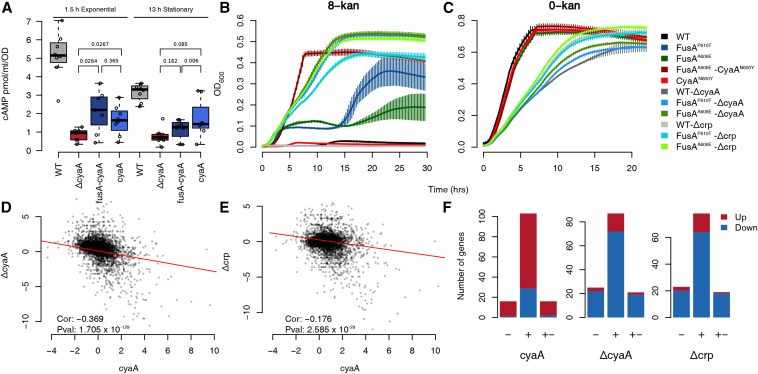
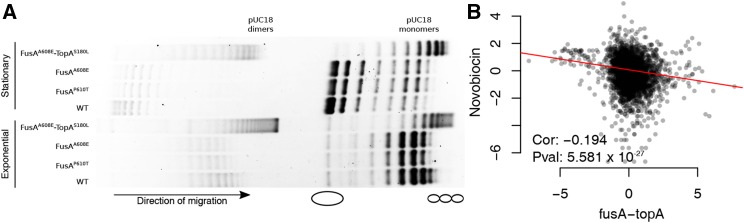
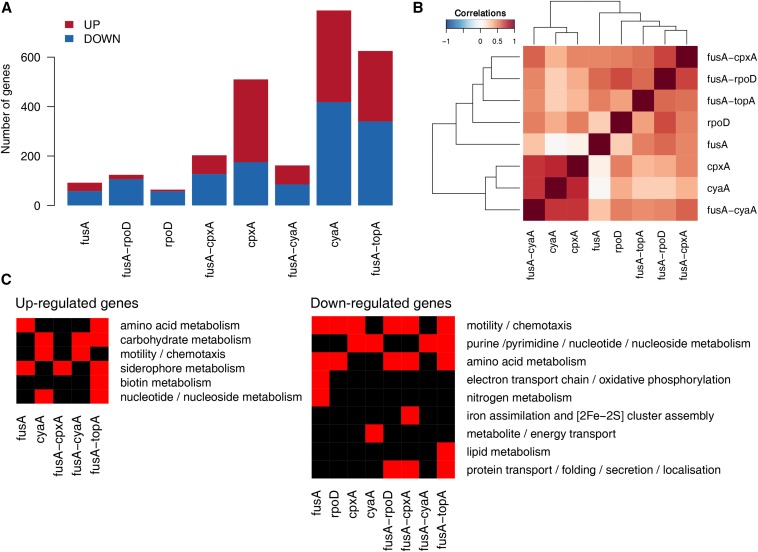
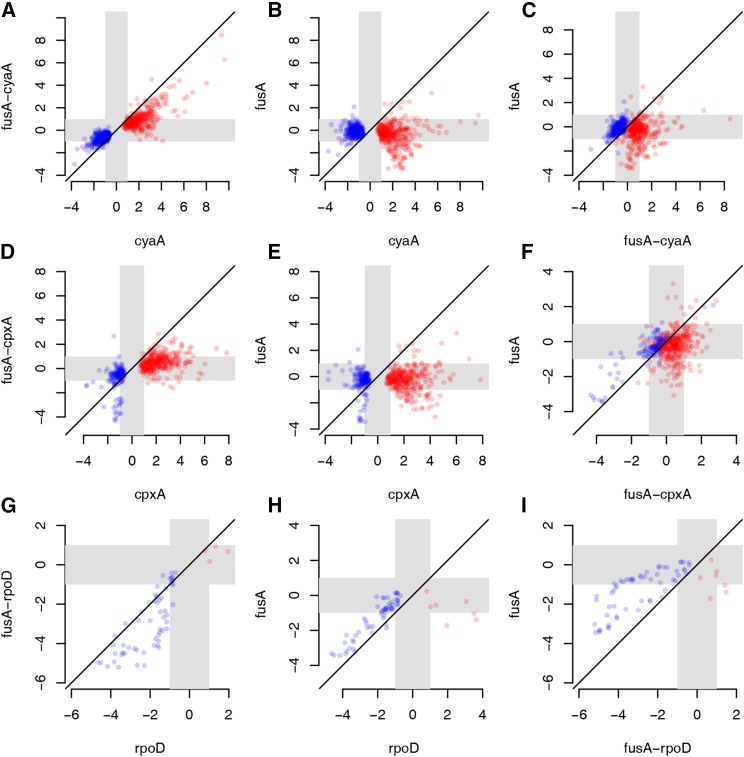
Evolve and resequence experiments have provided us a tool to understand bacterial adaptation to antibiotics. In our previous work, we used short-term evolution to isolate mutants resistant to the ribosome targeting antibiotic kanamycin, and reported that Escherichia coli develops low cost resistance to kanamycin via different point mutations in the translation Elongation Factor-G (EF-G). Furthermore, we had shown that the resistance of EF-G mutants could be increased by second site mutations in the genes rpoD/cpxA/topA/cyaA Mutations in three of these genes had been discovered in earlier screens for aminoglycoside resistance. In this work, we expand our understanding of these second site mutations, the goal being to understand how these mutations affect the activities of the mutated gene products to confer resistance. We show that the mutation in cpxA most likely results in an active Cpx stress response. Further evolution of an EF-G mutant in a higher concentration of kanamycin than what was used in our previous experiments identified the cpxA locus as a primary target for a significant increase in resistance. The mutation in cyaA results in a loss of catalytic activity and probably results in resistance via altered CRP function. Despite a reduction in cAMP levels, the CyaAN600Y mutant has a transcriptome indicative of increased CRP activity, pointing to an unknown role for CyaA and / or cAMP in gene expression. From the transcriptomes of double and single mutants, we describe the epistasis between the mutation in EF-G and these second site mutations. We show that the large scale transcriptomic changes in the topoisomerase I (FusAA608E-TopAS180L) mutant likely result from increased negative supercoiling in the cell. Finally, genes with known roles in aminoglycoside resistance were present among the misregulated genes in the mutants.
Keywords: aminoglycosides; antibiotic resistance; gene regulatory networks; kanamycin; transcription factors.
Copyright © 2017 Mogre et al.
Figures
Similar articles
-
Genomic analysis reveals distinct concentration-dependent evolutionary trajectories for antibiotic resistance in Escherichia coli.DNA Res. 2014 Dec;21(6):711-26. doi: 10.1093/dnares/dsu032. Epub 2014 Oct 3. DNA Res. 2014. PMID: 25281544 Free PMC article.
-
In vivo selection of conditional-lethal mutations in the gene encoding elongation factor G of Escherichia coli.J Bacteriol. 1994 Jan;176(1):123-9. doi: 10.1128/jb.176.1.123-129.1994. J Bacteriol. 1994. PMID: 8282687 Free PMC article.
-
Regulatory exaptation of the catabolite repression protein (Crp)-cAMP system in Pseudomonas putida.Environ Microbiol. 2011 Feb;13(2):324-39. doi: 10.1111/j.1462-2920.2010.02331.x. Epub 2010 Sep 8. Environ Microbiol. 2011. PMID: 21281420
-
Relationship between spontaneous aminoglycoside resistance in Escherichia coli and a decrease in oligopeptide binding protein.J Bacteriol. 1998 Oct;180(20):5484-8. doi: 10.1128/JB.180.20.5484-5488.1998. J Bacteriol. 1998. PMID: 9765586 Free PMC article.
-
[Mutation of the envelope stress-responsive protein CpxA capable of regulating the antimicrobial resistance and virulence of bacteria].Sheng Wu Gong Cheng Xue Bao. 2024 Jul 25;40(7):2022-2037. doi: 10.13345/j.cjb.240021. Sheng Wu Gong Cheng Xue Bao. 2024. PMID: 39044573 Review. Chinese.
Cited by
-
The Effect of the Stringent Response and Oxidative Stress Response on Fitness Costs of De Novo Acquisition of Antibiotic Resistance.Int J Mol Sci. 2024 Feb 23;25(5):2582. doi: 10.3390/ijms25052582. Int J Mol Sci. 2024. PMID: 38473832 Free PMC article.
-
Synthesis of 6″-Modified Kanamycin A Derivatives and Evaluation of Their Antibacterial Properties.Pharmaceutics. 2023 Apr 7;15(4):1177. doi: 10.3390/pharmaceutics15041177. Pharmaceutics. 2023. PMID: 37111662 Free PMC article.
-
Analysis of multidrug resistance in Streptococcus suis ATCC 700794 under tylosin stress.Virulence. 2019 Dec;10(1):58-67. doi: 10.1080/21505594.2018.1557505. Virulence. 2019. PMID: 31874073 Free PMC article.
-
Synthesis and Antibacterial Activity of New 6″-Modified Tobramycin Derivatives.Antibiotics (Basel). 2024 Dec 6;13(12):1191. doi: 10.3390/antibiotics13121191. Antibiotics (Basel). 2024. PMID: 39766581 Free PMC article.
-
Reactive oxygen species accelerate de novo acquisition of antibiotic resistance in E. coli.iScience. 2023 Oct 31;26(12):108373. doi: 10.1016/j.isci.2023.108373. eCollection 2023 Dec 15. iScience. 2023. PMID: 38025768 Free PMC article.
References
-
- Alexa, A., and J. Rahnenfuhrer, 2016 topGO: enrichment analysis for gene ontology. R package version 2.26.0. Available at: http://bioconductor.uib.no/2.7/bioc/html/topGO.html.Yeref
-
- Andersson D. I., 2006. The biological cost of mutational antibiotic resistance: any practical conclusions? Curr. Opin. Microbiol. 9: 461–465. - PubMed
-
- Andersson D. I., Hughes D., 2010. Antibiotic resistance and its cost: is it possible to reverse resistance? Nat. Rev. Microbiol. 8: 260–271. - PubMed
-
- Andersson D. I., Levin B. R., 1999. The biological cost of antibiotic resistance. Curr. Opin. Microbiol. 2: 489–493. - PubMed
MeSH terms
Substances
Grants and funding
LinkOut - more resources
Full Text Sources
Other Literature Sources
Molecular Biology Databases
Research Materials
Miscellaneous