. 2017 Dec 14;92(1):e01457-17.
doi: 10.1128/JVI.01457-17. Print 2018 Jan 1.

Flow Cytometric Detection of PrPSc in Neurons and Glial Cells from Prion-Infected Mouse Brains

Affiliations

Flow Cytometric Detection of PrPSc in Neurons and Glial Cells from Prion-Infected Mouse Brains

Takeshi Yamasaki et al. J Virol. .

Abstract

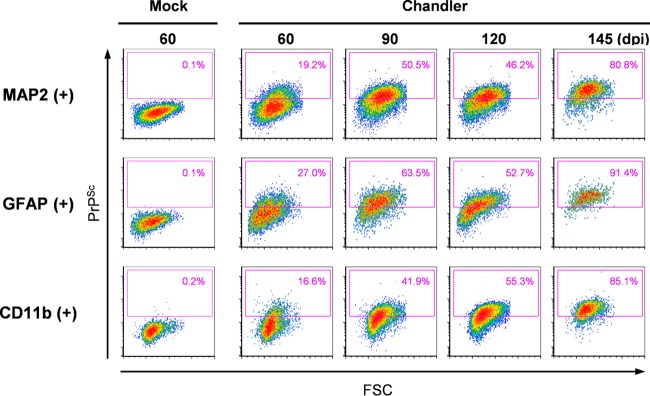
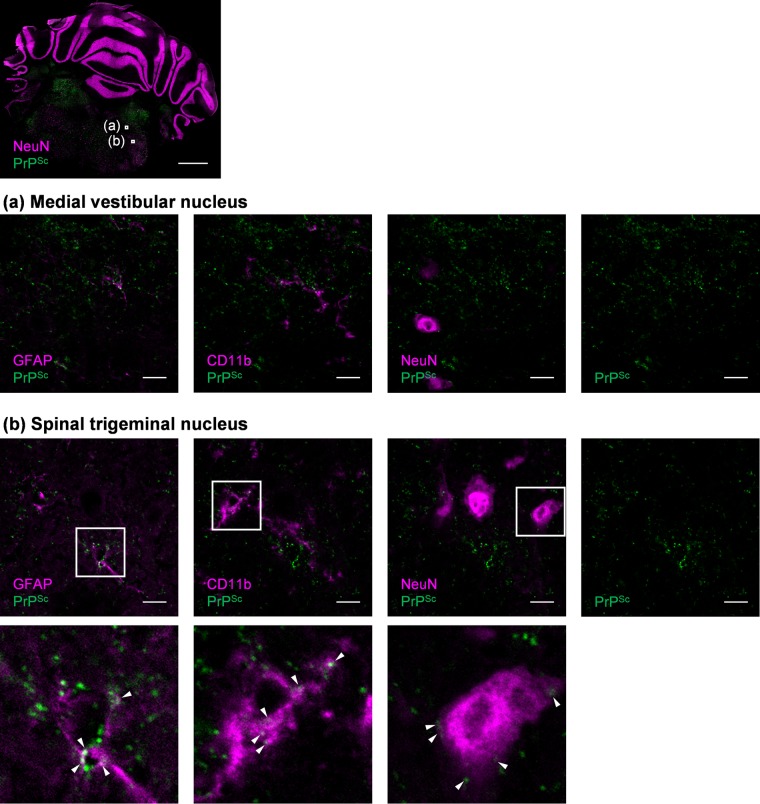
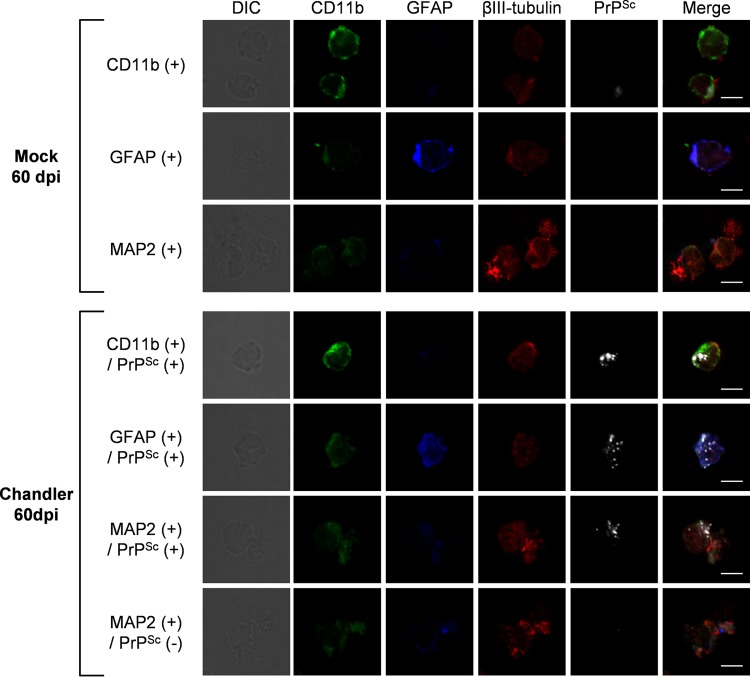
In prion diseases, an abnormal isoform of prion protein (PrPSc) accumulates in neurons, astrocytes, and microglia in the brains of animals affected by prions. Detailed analyses of PrPSc-positive neurons and glial cells are required to clarify their pathophysiological roles in the disease. Here, we report a novel method for the detection of PrPSc in neurons and glial cells from the brains of prion-infected mice by flow cytometry using PrPSc-specific staining with monoclonal antibody (MAb) 132. The combination of PrPSc staining and immunolabeling of neural cell markers clearly distinguished neurons, astrocytes, and microglia that were positive for PrPSc from those that were PrPSc negative. The flow cytometric analysis of PrPSc revealed the appearance of PrPSc-positive neurons, astrocytes, and microglia at 60 days after intracerebral prion inoculation, suggesting the presence of PrPSc in the glial cells, as well as in neurons, from an early stage of infection. Moreover, the kinetic analysis of PrPSc revealed a continuous increase in the proportion of PrPSc-positive cells for all cell types with disease progression. Finally, we applied this method to isolate neurons, astrocytes, and microglia positive for PrPSc from a prion-infected mouse brain by florescence-activated cell sorting. The method described here enables comprehensive analyses specific to PrPSc-positive neurons, astrocytes, and microglia that will contribute to the understanding of the pathophysiological roles of neurons and glial cells in PrPSc-associated pathogenesis.IMPORTANCE Although formation of PrPSc in neurons is associated closely with neurodegeneration in prion diseases, the mechanism of neurodegeneration is not understood completely. On the other hand, recent studies proposed the important roles of glial cells in PrPSc-associated pathogenesis, such as the intracerebral spread of PrPSc and clearance of PrPSc from the brain. Despite the great need for detailed analyses of PrPSc-positive neurons and glial cells, methods available for cell type-specific analysis of PrPSc have been limited thus far to microscopic observations. Here, we have established a novel high-throughput method for flow cytometric detection of PrPSc in cells with more accurate quantitative performance. By applying this method, we succeeded in isolating PrPSc-positive cells from the prion-infected mouse brains via fluorescence-activated cell sorting. This allows us to perform further detailed analysis specific to PrPSc-positive neurons and glial cells for the clarification of pathological changes in neurons and pathophysiological roles of glial cells.

Keywords: cell sorting; flow cytometry; prions.


Figures

FIG 1
FIG 1
Detection of PrPSc in prion-infected cells by flow cytometry. (A) Comparison of PrPC detection in uninfected cells and PrP detection in infected cells with anti-PrP MAbs using flow cytometry. N2a-3 or ScN2a-3-22L cells were harvested with collagenase. The cells were fixed with 4% PFA in PBS and treated with 5 M GdnSCN (Gdn +) or remained untreated (Gdn −). The cells were stained with anti-PrP MAbs 106, 132, 31C6, and 44B1 and then subjected to flow cytometric analysis. In the histograms, red lines show the signals of ScN2a-3-22L cells, blue lines show signals of N2a-3 cells, and the black line and black dashed line show the signals of the infected and uninfected cells, respectively, stained with isotype control antibodies (P2-284). The table shows mean fluorescence intensity (MFI) of PrP signals detected by each MAb. MFI ratios of ScN2a3-22L to N2a-3 cells are also indicated. (B) Detection of PrP by fluorescence microscopy. N2a-3 and ScN2a-3-22L cells stained with the anti-PrP MAbs for flow cytometry were pelleted, and cell nuclei were counterstained with DAPI. The cells were mounted on a glass slide and analyzed by fluorescence microscopy. The PrP signals are shown as green and the cell nuclei are shown as blue (scale, 10 μm). (C) Detection of PrP-res by immunoblotting. N2a-3, ScN2a-3-22L, ScN2a-3-Ch, GT1-7, and ScGT1-7-22L cells were harvested with collagenase. The cell lysates were subjected to immunoblotting after PK treatment. (D) Flow cytometric detection of PrPSc. The cells harvested with collagenase were subjected to PrPSc-specific staining with MAb 132. The histograms show signals of PrP in N2a-3 (blue line) and ScN2a3-22L (red line) cells, PrP signals in N2a-3 (blue line) and ScN2a-3-Ch (orange line) cells, and PrP signals in GT1-7 (blue line) and ScGT1-7-22L (purple line) cells. The black lines and black dashed lines in the histograms show the signals of the isotype control antibody.
FIG 2
FIG 2
Method for flow cytometric analysis for neural cells from mouse brains. (A) Cell viability. Mock-infected mouse brain at 120 dpi was dissociated with a papain-based enzyme and mechanical trituration. The cell nuclei were counterstained with DRAQ5, and the dead cells were labeled with PI. Cell bodies positive for DRAQ5 were gated to remove cell debris (far left), and then the single events (singlets) were gated based on the profiles of FSC and SSC (second from the left) and the profiles of SSC area and SSC height (third from the left). The rightmost histogram shows PI signals. The percentage of PI-positive cells is indicated in the histogram. (B) Effects of cell debris removal by density gradient centrifugation and GdnSCN treatment on cell marker signals. Cell suspensions prepared from Chandler strain-infected mouse brains and mock-infected mouse brains at 120 dpi were fixed with 4% PFA. Cell debris was removed by density gradient centrifugation (cell debris removal +), or this step was omitted (cell debris removal −). The cells were subjected to GFAP and CD11b labeling and then fixed again with 4% PFA. The cells were treated with 2.5 M GdnSCN (Gdn +) or left untreated (Gdn −). Immediately before flow cytometric analysis, cell nuclei were counterstained with 7-AAD. In the analysis, 7-AAD-positive cell bodies were gated (far left), and single events were gated based on the profiles of FSC and SSC (second from the left) and the profiles of SSC area and SSC height (third from the left). The rightmost cytograms show GFAP and CD11b signals. Percentages of the gated cell populations against the parent populations are indicated.
FIG 3
FIG 3
Flow cytometric detection of PrPSc in neurons, astrocytes, and microglia from prion-infected mouse brains. (A) Gating strategies for flow cytometric analysis. Cell suspensions were prepared from the mock-infected mouse brains (left) and Chandler strain-infected mouse brains (right) at 120 dpi. The cell suspensions were subjected to the staining of CD11b, GFAP, MAP2, and PrPSc; cell nuclei were stained with 7-AAD. For flow cytometric analysis, single-event gating was performed as shown in Fig. 2B. The single events were separated into CD11b-positive and CD11b-negative cell populations based on the profile of the CD11b signals. The GFAP-positive and MAP2-positive cell populations were gated based on the profiles of the MAP2 and GFAP signals of the CD11b-negative cell populations. PrPSc signals were analyzed in CD11b-positive, GFAP-positive, MAP2-positive, and 7-AAD-positive cell populations. The sequential gating strategy is shown by the magenta-colored polygonal boxes and arrows. (B) PrPSc signals in each cell population. The histograms show the PrPSc signals of CD11b-positive, GFAP-positive, MAP2-positive, and 7-AAD-positive cell populations. The blue and red lines show PrPSc signals in mock-infected samples (top column) and Chandler strain-infected samples (bottom column), respectively. The black lines show the signals labeled with isotype control antibody.
FIG 4
FIG 4
Extracellular PrPSc does not affect PrPSc detection. Cell suspensions were prepared at 145 dpi from the left brain hemisphere from an uninfected ROSA26-EGFP reporter mouse (left), from the left brain hemisphere from a Chandler strain-infected mouse (center), and from a mixture of the right brain hemispheres from ROSA26-EGFP and Chandler-infected mice (right). The cell suspensions were subjected to GFP staining with anti-GFP antibodies and BV421-conjugated secondary antibodies. After fixation, the cells subsequently were subjected to PrPSc staining with MAb 132-Af647. The cytograms show GFP and PrPSc signals. The magenta lines represent the threshold levels for GFP and PrPSc. Percentages of each population are indicated in quadrants in the cytograms.
FIG 5
FIG 5
Kinetics of PrPSc-positive neurons, astrocytes, and microglia from Chandler-infected mouse brains. Cell suspensions prepared from the brains of Chandler-infected mice at 60, 90, 120, and 145 dpi and from the brains of mock-infected mice at 60 dpi were subjected to flow cytometric analysis for CD11b, GFAP, MAP2, and PrPSc. Representative data from two independent experiments are shown. Gating strategies are shown in Fig. 3. The panels show the cytograms of FSC and PrPSc signals of MAP2-positive (top), GFAP-positive (middle), and CD11b-positive (bottom) cells. PrPSc-positive cell populations are shown in magenta boxes in the cytograms. The threshold level of PrPSc is the same in all samples. Percentages of PrPSc-positive cells are indicated in the cytograms.
FIG 6
FIG 6
Detection of PrPSc in neurons, astrocytes, and microglia in a frozen section. The frozen brain section of the Chandler-infected mouse at 60 dpi was subjected to multiple staining of CD11b, GFAP, NeuN, and PrPSc. The images of each cell marker (magenta) and PrPSc (green) are shown. The top image is a merged image of NeuN and PrPSc on the coronal section containing cerebellum and pons (scale, 1 mm). The magnified image of the medial vestibular nucleus (a) and the spinal trigeminal nucleus (b) indicated by white boxes in the top image are shown below (scale, 10 μm). The panel shows merged images of GFAP and PrPSc (far left), CD11b and PrPSc (second from the left), and NeuN and PrPSc (second from the right); a single image of PrPSc is on the far right. The bottom panel shows increased magnifications of the boxed regions in the spinal trigeminal nucleus images. Colocalization of PrPSc and each individual cell marker is shown with arrowheads.
FIG 7
FIG 7
Fluorescence-activated cell sorting of PrPSc-positive cells. Cell suspensions equivalent to one-fifth of a brain of a Chandler-infected mouse at 60 dpi and that of a mock-infected mouse at 60 dpi were subjected to multiple staining of CD11b, GFAP, MAP2, and PrPSc. Approximately 15,000 CD11b-positive cells, 8,500 GFAP-positive cells, and 13,000 MAP2-positive cells were isolated from the mock-infected mouse brain sample. Approximately 500 CD11b- and PrPSc-positive cells, 900 GFAP- and PrPSc-positive cells, 800 MAP2- and PrPSc-positive cells, and 19,000 MAP2-positive and PrPSc-negative cells were isolated from the Chandler-infected mouse brain sample using a cell sorter. Isolated cells subsequently were subjected to βIII-tubulin staining to label neurons. The panels show representative images of isolated cells. The far left column shows differential interference contrast cell images. The far right column shows the merged images of CD11b (green), GFAP (blue), βIII-tubulin (red), and PrPSc (white). The individual images of CD11b, GFAP, βIII-tubulin, and PrPSc are shown on the second to fifth column from the left (scale, 5 μm).

Similar articles

Cited by

References

    1. Jeffrey M, McGovern G, Sisó S, González L. 2011. Cellular and sub-cellular pathology of animal prion diseases: relationship between morphological changes, accumulation of abnormal prion protein and clinical disease. Acta Neuropathol 121:113–134. doi:10.1007/s00401-010-0700-3. - DOI - PubMed
    1. Senesi M, Lewis V, Kim JH, Adlard PA, Finkelstein DI, Collins SJ. 2017. In vivo prion models and the disconnection between transmissibility and neurotoxicity. Ageing Res Rev 36:156–164. doi:10.1016/j.arr.2017.03.007. - DOI - PubMed
    1. Halliday M, Radford H, Mallucci GR. 2014. Prions: generation and spread versus neurotoxicity. J Biol Chem 289:19862–19868. doi:10.1074/jbc.R114.568477. - DOI - PMC - PubMed
    1. Soto C, Satani N. 2011. The intricate mechanisms of neurodegeneration in prion diseases. Trends Mol Med 17:14–24. doi:10.1016/j.molmed.2010.09.001. - DOI - PMC - PubMed
    1. Büeler H, Aguzzi A, Sailer A, Greiner RA, Autenried P, Aguet M, Weissmann C. 1993. Mice devoid of PrP are resistant to scrapie. Cell 73:1339–1347. doi:10.1016/0092-8674(93)90360-3. - DOI - PubMed

Publication types

MeSH terms

LinkOut - more resources