

Reevaluation of immune activation in the era of cART and an aging HIV-infected population
- PMID: 29046481
- PMCID: PMC5846952
- DOI: 10.1172/jci.insight.95726
Reevaluation of immune activation in the era of cART and an aging HIV-infected population
Abstract
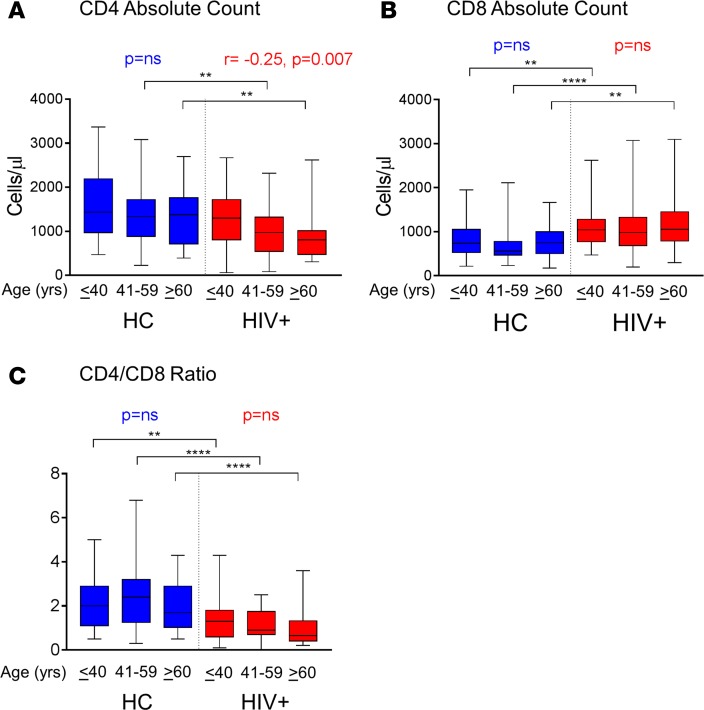
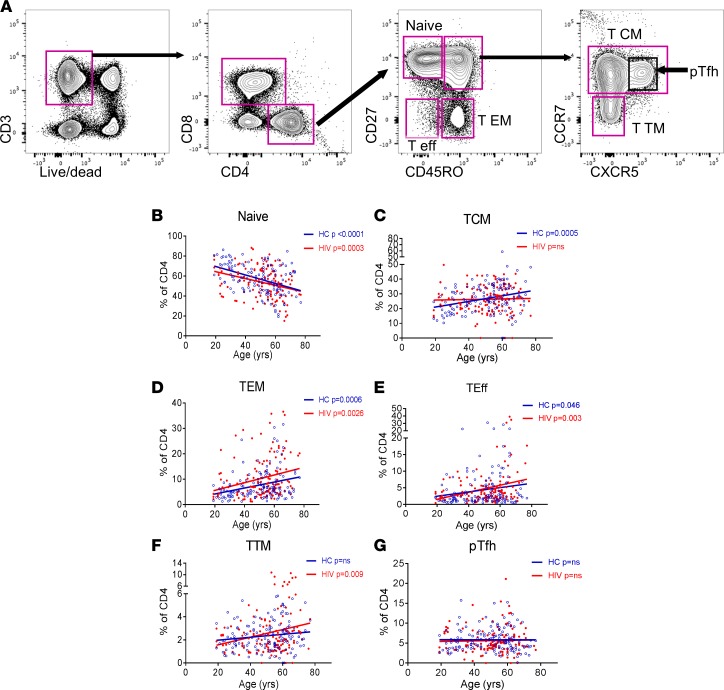
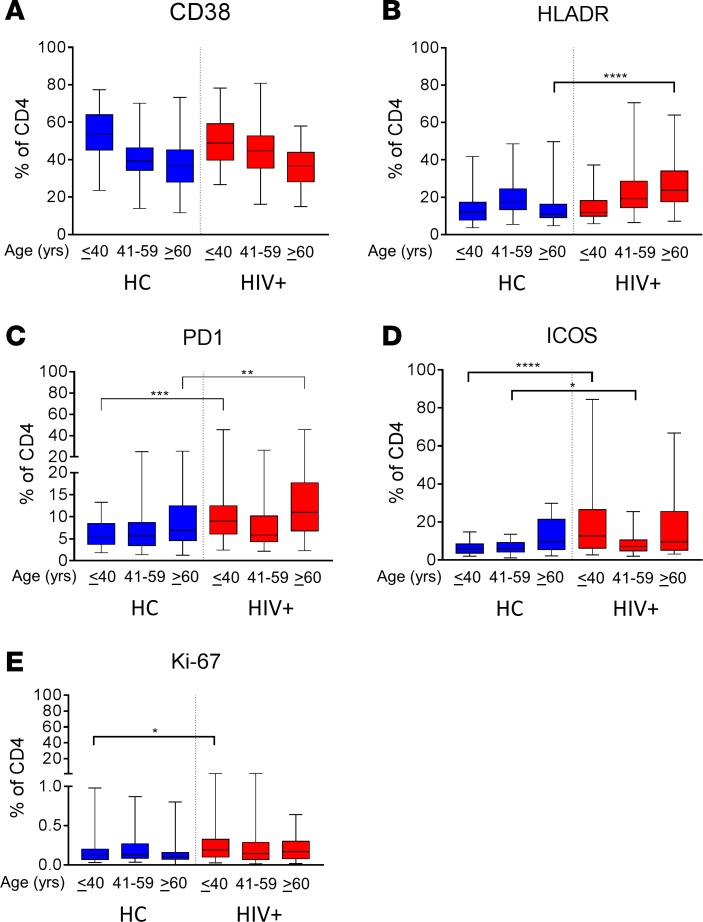
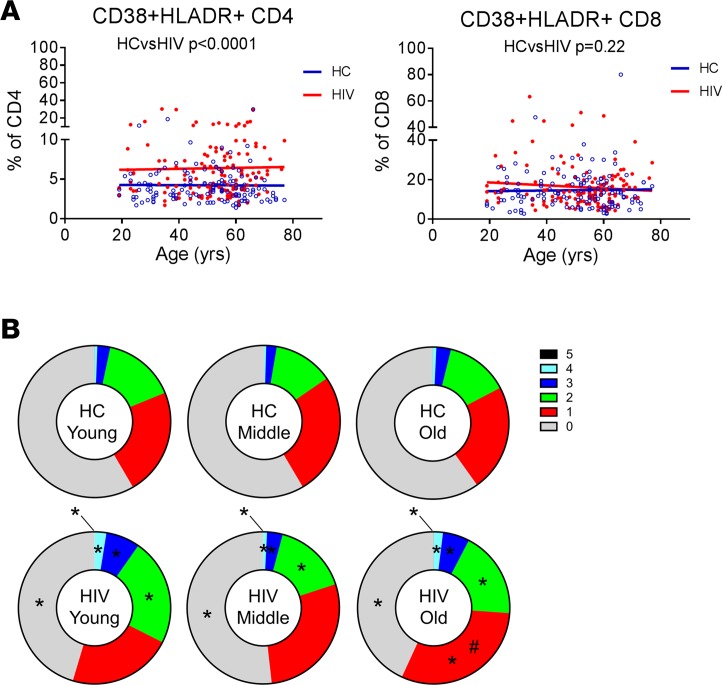
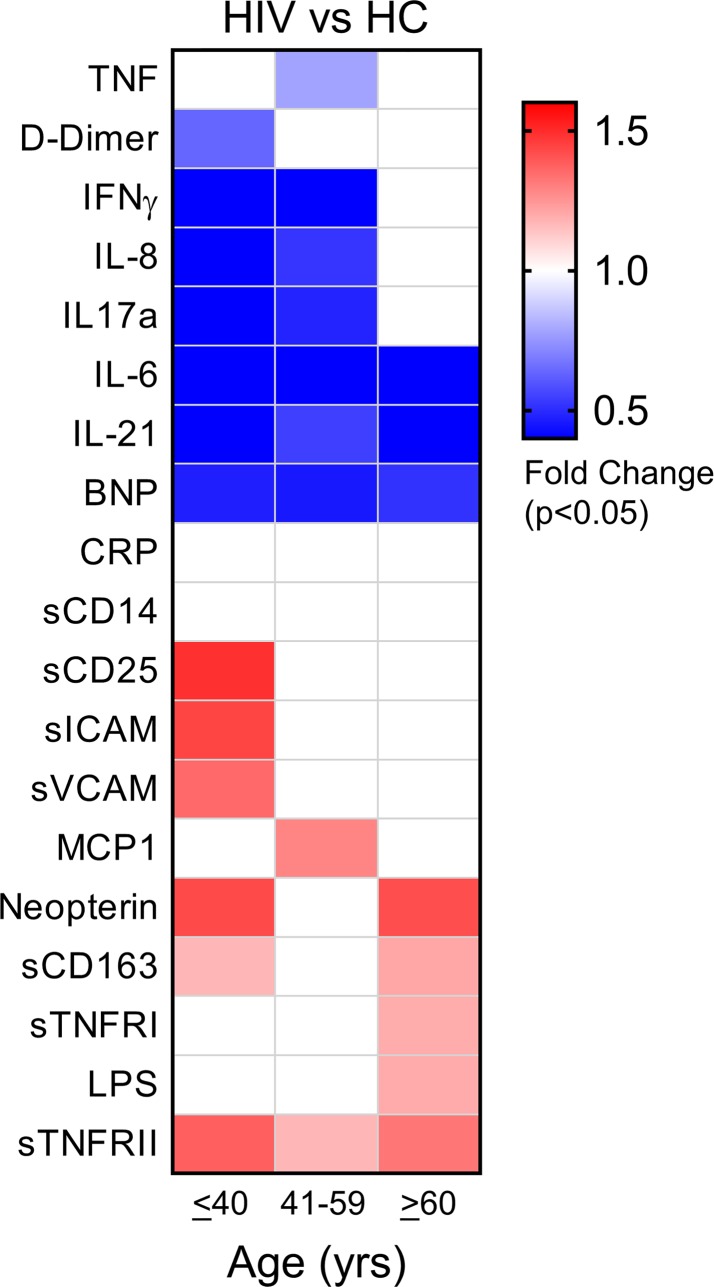
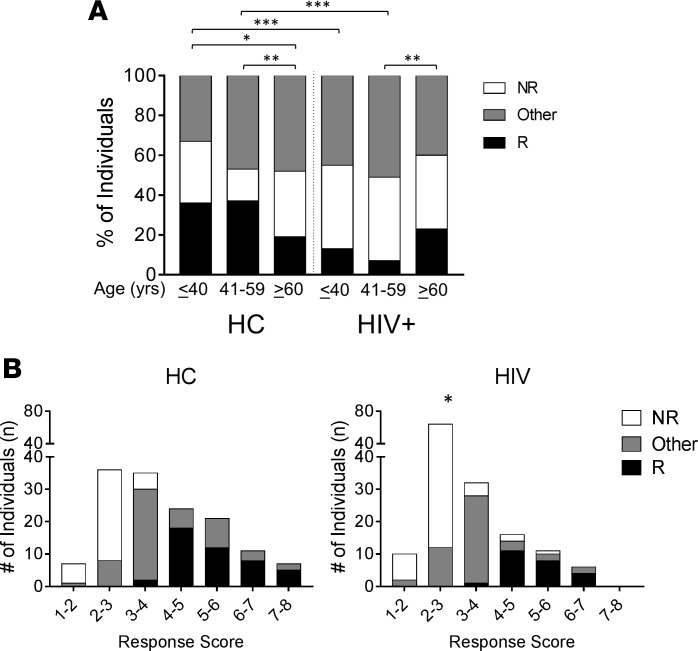
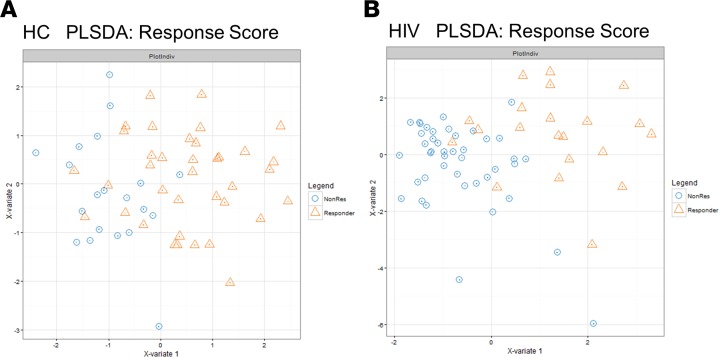
Biological aging is associated with immune activation (IA) and declining immunity due to systemic inflammation. It is widely accepted that HIV infection causes persistent IA and premature immune senescence despite effective antiretroviral therapy and virologic suppression; however, the effects of combined HIV infection and aging are not well defined. Here, we assessed the relationship between markers of IA and inflammation during biological aging in HIV-infected and -uninfected populations. Antibody response to seasonal influenza vaccination was implemented as a measure of immune competence and relationships between IA, inflammation, and antibody responses were explored using statistical modeling appropriate for integrating high-dimensional data sets. Our results show that markers of IA, such as coexpression of HLA antigen D related (HLA-DR) and CD38 on CD4+ T cells, exhibit strong associations with HIV infection but not with biological age. Certain variables that showed a strong relationship with aging, such as declining naive and CD38+ CD4 and CD8+ T cells, did so regardless of HIV infection. Interestingly, the variable of biological age was not identified in a predictive model as significantly impacting vaccine responses in either group, while distinct IA and inflammatory variables were closely associated with vaccine response in HIV-infected and -uninfected populations. These findings shed light on the most relevant and persistent immune defects during virological suppression with antiretroviral therapy.
Conflict of interest statement
Figures
Similar articles
-
Impaired antibody response to influenza vaccine in HIV-infected and uninfected aging women is associated with immune activation and inflammation.PLoS One. 2013 Nov 13;8(11):e79816. doi: 10.1371/journal.pone.0079816. eCollection 2013. PLoS One. 2013. PMID: 24236161 Free PMC article.
-
Impact of aging and HIV infection on serologic response to seasonal influenza vaccination.AIDS. 2018 Jun 1;32(9):1085-1094. doi: 10.1097/QAD.0000000000001774. AIDS. 2018. PMID: 29424779 Free PMC article.
-
Short Intracellular HIV-1 Transcripts as Biomarkers of Residual Immune Activation in Patients on Antiretroviral Therapy.J Virol. 2016 May 27;90(12):5665-5676. doi: 10.1128/JVI.03158-15. Print 2016 Jun 15. J Virol. 2016. PMID: 27030274 Free PMC article.
-
Accelerated immune senescence and HIV-1 infection.Exp Gerontol. 2007 May;42(5):432-7. doi: 10.1016/j.exger.2006.12.003. Epub 2007 Jan 8. Exp Gerontol. 2007. PMID: 17307327 Review.
-
Immune activation and CD8+ T-cell differentiation towards senescence in HIV-1 infection.PLoS Biol. 2004 Feb;2(2):E20. doi: 10.1371/journal.pbio.0020020. Epub 2004 Feb 17. PLoS Biol. 2004. PMID: 14966528 Free PMC article. Review.
Cited by
-
Dysfunctional peripheral T follicular helper cells dominate in people with impaired influenza vaccine responses: Results from the FLORAH study.PLoS Biol. 2019 May 17;17(5):e3000257. doi: 10.1371/journal.pbio.3000257. eCollection 2019 May. PLoS Biol. 2019. PMID: 31100059 Free PMC article.
-
Inflammatory and immune markers in HIV-infected older adults on long-term antiretroviral therapy: Persistent elevation of sCD14 and of proinflammatory effector memory T cells.Aging Cell. 2022 Sep;21(9):e13681. doi: 10.1111/acel.13681. Epub 2022 Aug 16. Aging Cell. 2022. PMID: 35975357 Free PMC article.
-
Naïve/Effector CD4 T cell ratio as a useful predictive marker of immune reconstitution in late presenter HIV patients: A multicenter study.PLoS One. 2019 Dec 23;14(12):e0225415. doi: 10.1371/journal.pone.0225415. eCollection 2019. PLoS One. 2019. PMID: 31869342 Free PMC article.
-
IL-21-IgFc immunotherapy alters transcriptional landscape of lymph node cells leading to enhanced flu vaccine response in aging and SIV infection.Aging Cell. 2023 Nov;22(11):e13984. doi: 10.1111/acel.13984. Epub 2023 Sep 15. Aging Cell. 2023. PMID: 37712598 Free PMC article.
-
DNA Methylation and Immune Cell Markers Demonstrate Evidence of Accelerated Aging in Patients with Chronic Hepatitis B Virus or Hepatitis C Virus, with or without Human Immunodeficienct Virus Co-infection.Clin Infect Dis. 2021 Jul 1;73(1):e184-e190. doi: 10.1093/cid/ciaa1371. Clin Infect Dis. 2021. PMID: 32915202 Free PMC article.
References
-
- Serrano-Villar S, et al. HIV-infected individuals with low CD4/CD8 ratio despite effective antiretroviral therapy exhibit altered T cell subsets, heightened CD8+ T cell activation, and increased risk of non-AIDS morbidity and mortality. PLoS Pathog. 2014;10(5):e1004078. doi: 10.1371/journal.ppat.1004078. - DOI - PMC - PubMed
Publication types
MeSH terms
Substances
Grants and funding
LinkOut - more resources
Full Text Sources
Other Literature Sources
Medical
Research Materials
