. 2017 Oct 19;2(20):e96789.
doi: 10.1172/jci.insight.96789.

Synaptopodin is upregulated by IL-13 in eosinophilic esophagitis and regulates esophageal epithelial cell motility and barrier integrity

Synaptopodin is upregulated by IL-13 in eosinophilic esophagitis and regulates esophageal epithelial cell motility and barrier integrity

Mark Rochman et al. JCI Insight. .

Abstract

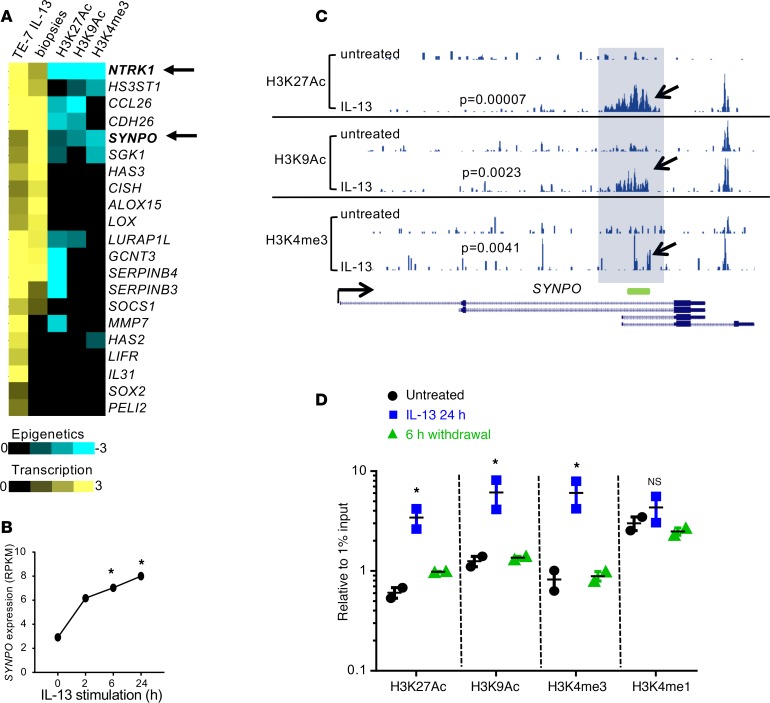
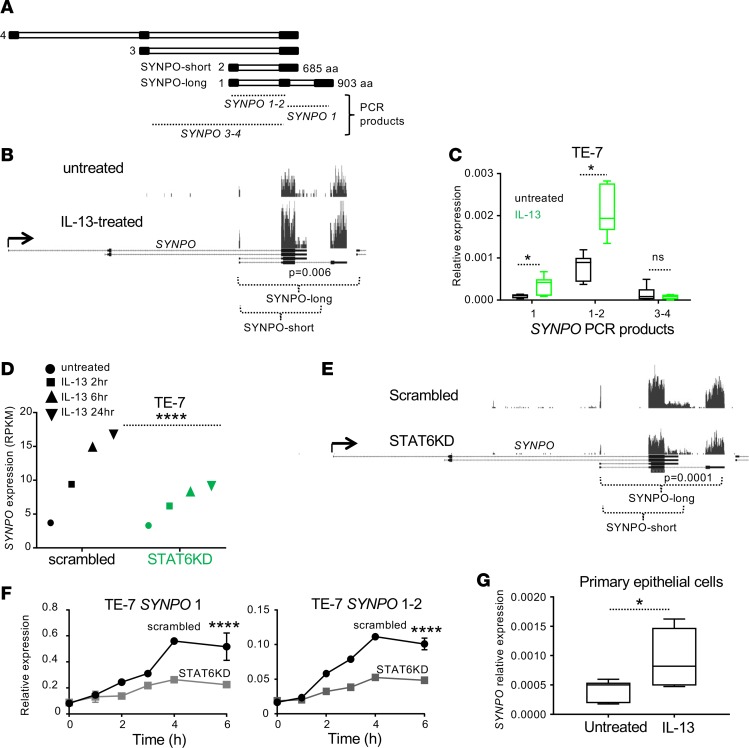
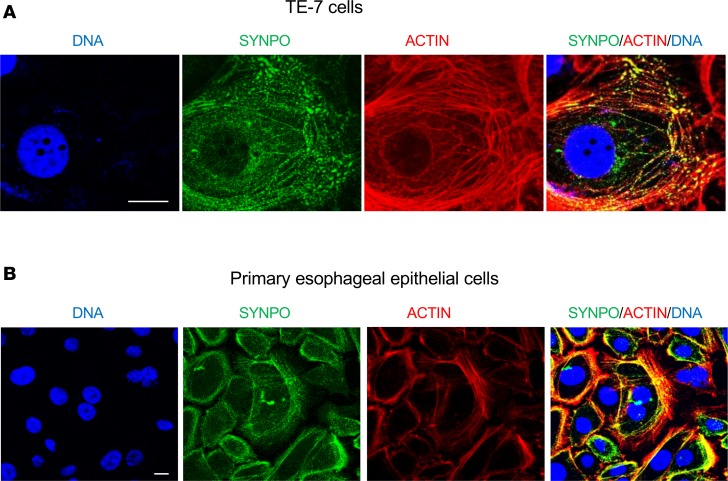
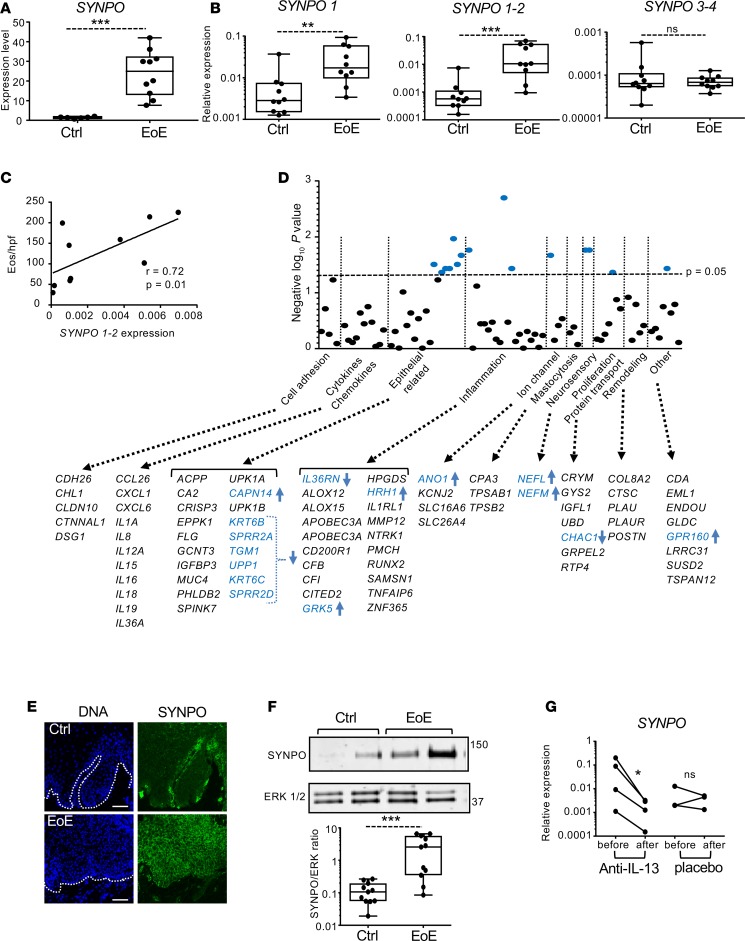
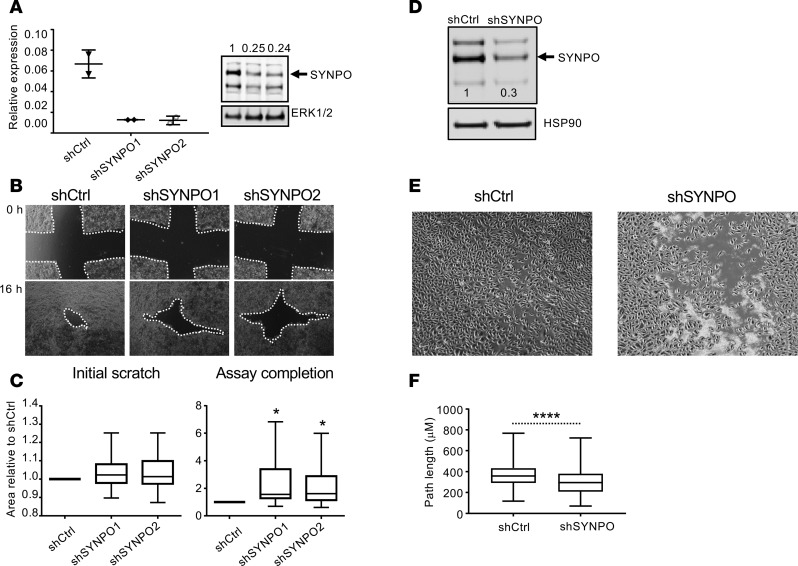
Eosinophilic esophagitis (EoE) is an allergic inflammatory disease of the esophagus mediated by an IL-13-driven epithelial cell transcriptional program. Herein, we show that the cytoskeletal protein synaptopodin (SYNPO), previously associated with podocytes, is constitutively expressed in esophageal epithelium and induced during allergic inflammation. In addition, we show that the SYNPO gene is transcriptionally and epigenetically regulated by IL-13 in esophageal epithelial cells. SYNPO was expressed in the basal layer of homeostatic esophageal epithelium, colocalized with actin filaments, and expanded into the suprabasal epithelium in EoE patients, where expression was elevated 25-fold compared with control individuals. The expression level of SYNPO in esophageal biopsies correlated with esophageal eosinophil density and was improved following anti-IL-13 treatment in EoE patients. In esophageal epithelial cells, SYNPO gene silencing reduced epithelial motility in a wound healing model, whereas SYNPO overexpression impaired epithelial barrier integrity and reduced esophageal differentiation. Taken together, we demonstrate that SYNPO is induced by IL-13 in vitro and in vivo, is a nonredundant regulator of epithelial cell barrier function and motility, and is likely involved in EoE pathogenesis.


Figures

Figure 1
Figure 1. Transcriptional and epigenetic regulation of SYNPO in TE-7 cells.
(A) The heatmap shows transcriptional and epigenetic changes in TE-7 cells in response to IL-13 stimulation for 6 hours or eosinophilic esophagitis (EoE) biopsies compared with controls. The yellow color represents log2 fold change in gene expression compared with controls, and the blue color represents M values for the indicated histone mark (note that negative M value indicates increased level of epigenetic marks; see Methods for details). (B) The expression of SYNPO in TE-7 cells stimulated with IL-13 at 100 ng/ml is shown (data are from ref. 15). *P < 0.05, DESeq analysis. RPKM, reads per kilobase per million reads. (C) An image capture from the USCS browser shows the epigenetic landscape for H3K27Ac, H3K9Ac, and H3K4me3 marks in TE-7 cells in the SYNPO gene. The promoter area of SYNPO isoforms 1 and 2 (see Figure 2A for details) is shaded. Arrows point to the histone mark peaks that are significantly increased after 6 hours of IL-13 stimulation. P values comparing IL-13–stimulated cells with untreated cells were calculated by using a MAnorm algorithm. The green rectangle shows the position of the probe used for ChIP-PCR experiments. The read depths of the aligned sequences are of the same scale. (D) The level of the indicated epigenetic marks was assessed in the promoter of SYNPO isoforms 1 and 2 by ChIP-PCR after a 24-hour IL-13 stimulation and subsequent IL-13 withdrawal for 6 hours. One of two independent experiments is shown; the dots represent the mean ± SD for technical replicates. *P < 0.05, compared with untreated cells by ANOVA.
Figure 2
Figure 2. SYNPO expression in esophageal epithelial cells.
(A) Schematic structure of the SYNPO isoforms; black and white rectangles represent exons and introns, respectively. SYNPO-long and SYNPO-short represent the common protein isoforms 1 and 2, respectively. The SYNPO regions detected by RT-PCR are indicated by dotted lines; SYNPO 1–2 and SYNPO 3–4 represent common PCR products for indicated isoforms. (B) An image capture from the USCS browser shows aligned RNA-sequencing reads on the SYNPO gene in TE-7 cells either untreated or treated with IL-13 for 24 hours. Black rectangles represent exons. The indicated P value comparing expression under these conditions was calculated by DESeq analysis (59). Note that reads are detected only on the exons corresponding to SYNPO-long and SYNPO-short isoforms. (C) Expression of SYNPO isoforms by TE-7 cells induced by IL-13 was assessed by RT-PCR. *P < 0.05, t test. (D) Expression of SYNPO was assessed by RNA sequencing in TE-7 cells subjected to gene silencing control (scrambled) and STAT6 knockdown (STAT6KD) pool. SYNPO expression in RPKM is shown. ****P < 0.0001 for 24-hour time point, DESeq analysis. (E) An image capture from the USCS browser shows aligned RNA-sequencing reads on the SYNPO gene in control TE-7 cells and STAT6KD pool from D. Note that both isoforms are affected by the knockdown. The indicated P value comparing expression under these conditions was calculated by DESeq analysis (59). (F) Expression of SYNPO isoforms (mean ± SD) was assessed by RT-PCR. ****P < 0.001, Holm-Sidak method. (G) Expression of SYNPO was analyzed in primary esophageal epithelial cells stimulated with IL-13. Combined data from cells isolated from 3 independent biopsies are shown. *P < 0.05, t test. For C, F, and G, expression was normalized to expression of GAPDH. For box-and-whisker plots, the box represents 50th percentile of the data, whiskers show minimum and maximum values, and the line in the box represents the median. For B and E, the read depth is of the same scale within each panel.
Figure 3
Figure 3. SYNPO is an actin-associated protein in esophageal epithelial cells.
(A) Representative immunofluorescence images of SYNPO (green) in the esophageal epithelial TE-7 cell line. (B) Primary esophageal epithelial cells isolated from biopsies. DNA was labeled by Hoechst (blue), and actin was stained with phalloidin (red). The merged image shows partial colocalization of SYNPO and actin (yellow). Original magnification: ×60 (A); ×40 (B); scale bars: 10 μM.
Figure 4
Figure 4. Expression of SYNPO in esophageal biopsies and correlation with EoE transcriptome.
(A) The normalized expression level for SYNPO in esophageal biopsy tissue from patients with active EoE (n = 10) and control patients (n = 6) (8). ***P < 0.001, t test. (B) The relative expression level of SYNPO isoforms (see Figure 2A) in esophageal biopsies from patients with active EoE and without EoE (Ctrl) was quantified by measuring expression of SYNPO PCR products. For AC, each dot represents an esophageal biopsy from independent patients. (A and B) **P < 0.01, ***P < 0.001, Holm-Sidak method. (C) The correlation between the expression of SYNPO (PCR product 1–2) and the number of eosinophils per high-power field (Eos/hpf) in an EoE esophageal biopsies. The Spearman correlation (r) and P value are indicated. (D) The graph shows correlation of SYNPO expression with EoE molecular signature genes from RNA-sequencing analysis of EoE patients (8). Gene categories were based on those used for the molecular diagnostics panel for EoE (27). The significance of the correlation is plotted as a negative log(10) P value. The horizontal dashed line represents P = 0.05. The genes probed in each category are indicated; significantly correlated genes are in blue font. Arrows indicate positive (up) and negative (down) correlation. (E) Representative immunofluorescence of SYNPO in esophageal biopsies from independent patients. The white dotted line demarcates the basement membrane. Scale bar: 100 μM. (F) A representative Western blot for SYNPO in control and EoE biopsies; ERK 1/2 is used as a loading control. Quantification of SYNPO expression was performed in control and EoE biopsies from independent patients (n = 11 per each group). ***P < 0.001, Holm-Sidak method. (G) Relative expression level of SYNPO was assessed in the EoE patients either treated with anti–IL-13 antibody or placebo, as described in ref. . “Before” corresponds to the beginning of the study, and “after” corresponds to day 85 of the study. *P < 0.05, t test. For A, B, and G expression level was normalized to GAPDH. For box-and-whisker plots, the box represents 50th percentile of the data, whiskers show minimum and maximum values, and the line in the box represents the median.
Figure 5
Figure 5. Effect of SYNPO downregulation on esophageal epithelial cell mobility.
(A) Representative RT-PCR and Western blot of SYNPO after stable SYNPO downregulation by two shRNAs in TE-7 cells. The arrow points to SYNPO-long isoform. Expression of SYNPO normalized to ERK 1/2 and then to control shRNA is indicated; the dots represent the mean ± SD for technical duplicates. (B) A wound healing assay was performed in TE-7 cells. Representative images show the scratch area at the beginning of the experiment (0 hours, initial scratch) and at the endpoint (16 hours after initial scratch, assay completion). The white dotted line indicates the scratch area that was quantified in C. (C) Quantification is shown for 5 independent experiments performed in quadruplicates and normalized to the scratch area in control shRNA (shCtrl) samples at the endpoint (shCtrl assay completion); *P < 0.05, ANOVA. (D) A Western blot for SYNPO after stable SYNPO downregulation in EPC2 cells by shRNA (shSYNPO) is shown; the arrow points to SYNPO-long isoform. The relative level of SYNPO expression normalized to HSP90 and then to shCtrl SYNPO expression is indicated by the numbers on the image. (E) A representative image of the wound healing assay simultaneously performed for control cells and cells with downregulated SYNPO expression (shCtrl and shSYNPO, respectively) is shown for the assay completion (8 hours) time point. Note that the control cells are fully confluent, whereas the shSYNPO cells still have visible gaps. (F) The overall distance traveled by 300 cells in the wound over the course of the wound healing assay for three independent experiments combined are shown; ****P < 0.0001, t test. For box-and-whisker plots, graphs the box represents 50th percentile of the data, whiskers show minimum and maximum values, and the line in the box represents the median. Original magnification, ×10 (B and E).
Figure 6
Figure 6. Effect of SYNPO overexpression on epithelial differentiation and barrier function.
(A) The SYNPO-long level in overexpressed pools (SYNPO OE a and OE b, arrow) was quantified by Western blot and normalized to HSP90. (B) A schematic outline of the differentiation protocol for EPC2 cells grown at ALI. (C) Representative H&E staining of control (Ctrl) and SYNPO-overexpressing (OE) EPC2 cells grown at the ALI. Arrow points to the keratinized layer of differentiated epithelium. Scale bar: 50 μM. (D and E) The transepithelial resistance (TEER) and FITC-dextran flux measurements are shown for EPC2 cells grown at the ALI. (D) Data were normalized to TEER of control samples at day 4 of culture and represent an average of 3–4 independent experiments performed in triplicate. (E) Data are representative of 2 independent experiments performed with 3 independent ALI cultures. ****P < 0.0001, 1-way ANOVA. (F) The expression level of the indicated genes was assessed by RT-PCR at day 14 of the ALI culture. Expression was normalized to GAPDH and to control samples. The combined data for SYNPO OE pools from 3–4 independent experiments are shown (n = 7 for control cultures, n = 13 for SYNPO OE cultures). ***P < 0.001, ****P < 0.0001, t test. For DF, the data are presented as mean ± SEM.
Figure 7
Figure 7. Schematic representation of SYNPO expression and regulation in the esophageal epithelium.
Under normal conditions (NL) esophageal epithelium is characterized by strong intercellular contacts, and barrier integrity is preserved. In the homeostatic esophagus, SYNPO is expressed at the basal layer of the esophageal epithelium and interacts with actin filaments. SYNPO is transcribed at low levels, and its promoter is decorated by low levels of activating epigenetic marks. In EoE, IL-13 is secreted by tissue-resident lymphocytes, causing STAT-6–dependent transcriptional activation of SYNPO in esophageal epithelium accompanied by elevated levels of activating epigenetic marks in the promoter of SYNPO gene. Basal zone hyperplasia and expansion of SYNPO expression into the suprabasal layers of the esophagus are evident. Subsequently, epithelial barrier integrity is altered and eosinophils penetrate esophageal mucosa. Treatment of EoE patients with anti–IL-13 antibody or knocking down STAT6 in esophageal epithelial cells counteracts IL-13–dependent transcriptional and epigenetic changes of SYNPO. Note that cell nuclei are omitted for clarity.

Similar articles

Cited by

References

    1. Gour N, Wills-Karp M. IL-4 and IL-13 signaling in allergic airway disease. Cytokine. 2015;75(1):68–78. doi: 10.1016/j.cyto.2015.05.014. - DOI - PMC - PubMed
    1. Wills-Karp M. Interleukin-13 in asthma pathogenesis. Immunol Rev. 2004;202:175–190. doi: 10.1111/j.0105-2896.2004.00215.x. - DOI - PubMed
    1. Barnes PJ. Pathophysiology of allergic inflammation. Immunol Rev. 2011;242(1):31–50. doi: 10.1111/j.1600-065X.2011.01020.x. - DOI - PubMed
    1. Zimmermann N, et al. Transcript signatures in experimental asthma: identification of STAT6-dependent and -independent pathways. J Immunol. 2004;172(3):1815–1824. doi: 10.4049/jimmunol.172.3.1815. - DOI - PubMed
    1. Krishnamurthy P, Kaplan MH. STAT6 and PARP family members in the development of t cell-dependent allergic inflammation. Immune Netw. 2016;16(4):201–210. doi: 10.4110/in.2016.16.4.201. - DOI - PMC - PubMed

Publication types

MeSH terms