

Hypoxia increases glucose transporter 1 expression in bovine corpus luteum at the early luteal stage
- PMID: 29046497
- PMCID: PMC5709568
- DOI: 10.1292/jvms.17-0284
Hypoxia increases glucose transporter 1 expression in bovine corpus luteum at the early luteal stage
Abstract
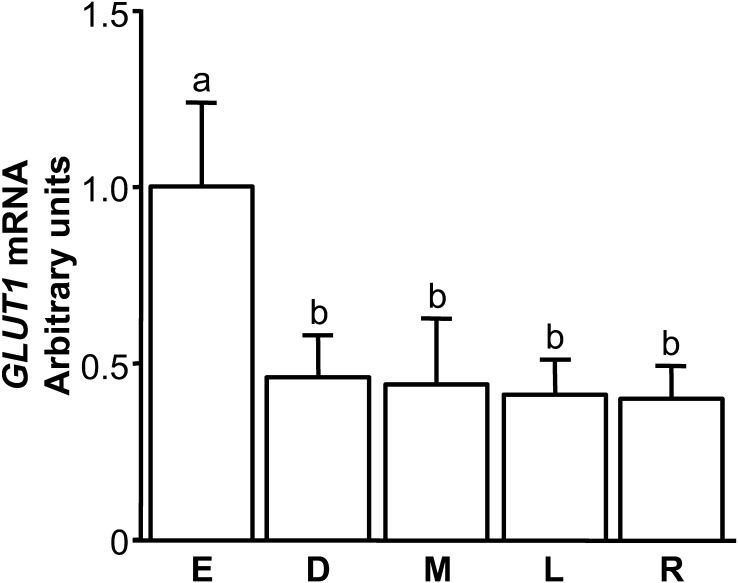
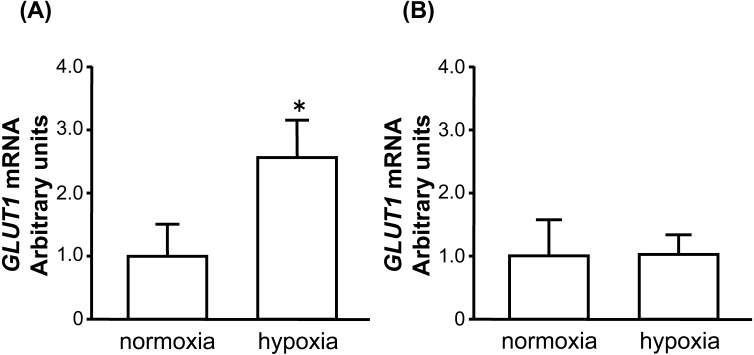
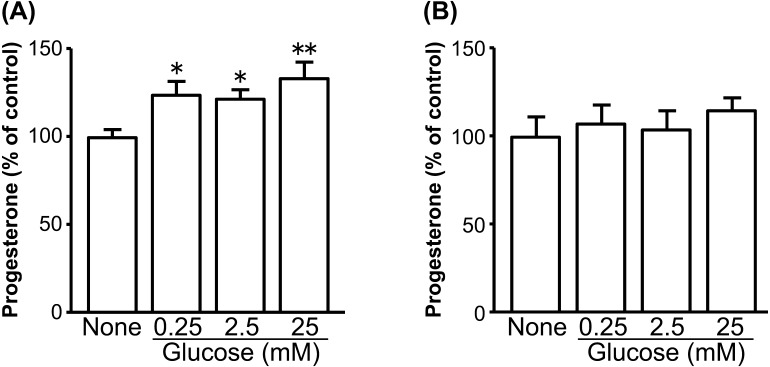
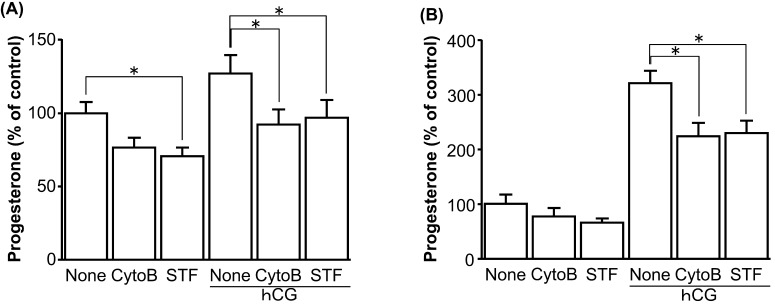
A major role of the corpus luteum (CL) is to produce progesterone (P4). The CL has immature vasculature shortly after ovulation, suggesting it exists under hypoxic conditions. Hypoxia-inducible factor-1 (HIF1) induces the expression of glucose transporter 1 (GLUT1). To clarify the physiological roles of GLUT1 in bovine CL, we examined GLUT1 mRNA expression in the CL under hypoxic conditions by quantitative RT-PCR. We also measured the effects of glucose (0-25 mM) and GLUT1 inhibitors (cytochalasin B, STF-31) on P4 production in bovine luteal cells. GLUT1 mRNA expression in bovine CL was higher at the early luteal stage compared to the other later stages. Hypoxia (3% O2) increased GLUT1 mRNA expression in early luteal cells, but not in mid luteal cells. Glucose (0-25 mM) increased P4 production in early luteal cells, but not in mid luteal cells. Both GLUT1 inhibitors decreased P4 production in early and mid luteal cells. Overall, the results suggest that GLUT1 (possibly induced by hypoxic conditions in the early CL) plays a role in the establishment and development of bovine CL, especially in supporting luteal P4 synthesis at the early luteal stage.
Keywords: HIF1; corpus luteum; glucose transporter-1; hypoxia; progesterone.
Figures
Similar articles
-
Multiple roles of hypoxia in bovine corpus luteum.J Reprod Dev. 2020 Aug 20;66(4):307-310. doi: 10.1262/jrd.2020-018. Epub 2020 Apr 4. J Reprod Dev. 2020. PMID: 32249240 Free PMC article. Review.
-
Effect of hypoxia on progesterone production by cultured bovine early and mid luteal cells.J Reprod Dev. 2019 Feb 8;65(1):67-72. doi: 10.1262/jrd.2018-061. Epub 2018 Nov 28. J Reprod Dev. 2019. PMID: 30487374 Free PMC article.
-
Gene expression of glucose transporter (GLUT) 1, 3 and 4 in bovine follicle and corpus luteum.J Endocrinol. 2006 Jan;188(1):111-9. doi: 10.1677/joe.1.06210. J Endocrinol. 2006. PMID: 16394180
-
Glucose transporter 1 expression accompanies hypoxia sensing in the cyclic canine corpus luteum.Reproduction. 2013 Nov 20;147(1):81-9. doi: 10.1530/REP-13-0398. Print 2014 Jan. Reproduction. 2013. PMID: 24140705
-
Regulation of progesterone synthesis and action in bovine corpus luteum.J Physiol Pharmacol. 2008 Dec;59 Suppl 9:75-89. J Physiol Pharmacol. 2008. PMID: 19261973 Review.
Cited by
-
Shikonin induces programmed death of fibroblast synovial cells in rheumatoid arthritis by inhibiting energy pathways.Sci Rep. 2021 Sep 14;11(1):18263. doi: 10.1038/s41598-021-97713-6. Sci Rep. 2021. PMID: 34521930 Free PMC article.
-
Metabolic control of luteinizing hormone-responsive ovarian steroidogenesis.J Biol Chem. 2025 Jan;301(1):108042. doi: 10.1016/j.jbc.2024.108042. Epub 2024 Nov 29. J Biol Chem. 2025. PMID: 39615688 Free PMC article.
-
Multiple roles of hypoxia in bovine corpus luteum.J Reprod Dev. 2020 Aug 20;66(4):307-310. doi: 10.1262/jrd.2020-018. Epub 2020 Apr 4. J Reprod Dev. 2020. PMID: 32249240 Free PMC article. Review.
-
Novel Therapeutic Targets for Hypoxia-Related Cardiovascular Diseases: The Role of HIF-1.Front Physiol. 2020 Jul 15;11:774. doi: 10.3389/fphys.2020.00774. eCollection 2020. Front Physiol. 2020. PMID: 32760290 Free PMC article. Review.
-
Dynamic Regulation of HIF1α and Oxygen-Sensing Factors in Cyclic Bovine Corpus Luteum and During LPS Challenge.Animals (Basel). 2025 Feb 19;15(4):595. doi: 10.3390/ani15040595. Animals (Basel). 2025. PMID: 40003076 Free PMC article.
References
-
- Berisha B., Schams D., Kosmann M., Amselgruber W., Einspanier R.2000. Expression and tissue concentration of vascular endothelial growth factor, its receptors, and localization in the bovine corpus luteum during estrous cycle and pregnancy. Biol. Reprod. 63: 1106–1114. doi: 10.1095/biolreprod63.4.1106 - DOI - PubMed
-
- Das U. G., Sadiq H. F., Soares M. J., Hay W. W., Jr., Devaskar S. U.1998. Time-dependent physiological regulation of rodent and ovine placental glucose transporter (GLUT-1) protein. Am. J. Physiol. 274: R339–R347. - PubMed
MeSH terms
Substances
LinkOut - more resources
Full Text Sources
Other Literature Sources
Miscellaneous