

Review
doi: 10.1038/s41559-017-0229-0.
Epub 2017 Jul 21.
Maximizing ecological and evolutionary insight in bisulfite sequencing data sets
Affiliations
- PMID: 29046582
- PMCID: PMC5656403
- DOI: 10.1038/s41559-017-0229-0
Item in Clipboard
Review
Maximizing ecological and evolutionary insight in bisulfite sequencing data sets
Nat Ecol Evol.
2017 Aug.
Abstract
Genome-scale bisulfite sequencing approaches have opened the door to ecological and evolutionary studies of DNA methylation in many organisms. These approaches can be powerful. However, they introduce new methodological and statistical considerations, some of which are particularly relevant to non-model systems. Here, we highlight how these considerations influence a study's power to link methylation variation with a predictor variable of interest. Relative to current practice, we argue that sample sizes will need to increase to provide robust insights. We also provide recommendations for overcoming common challenges and an R Shiny app to aid in study design.
Conflict of interest statement
We declare no conflict of interest.
Figures
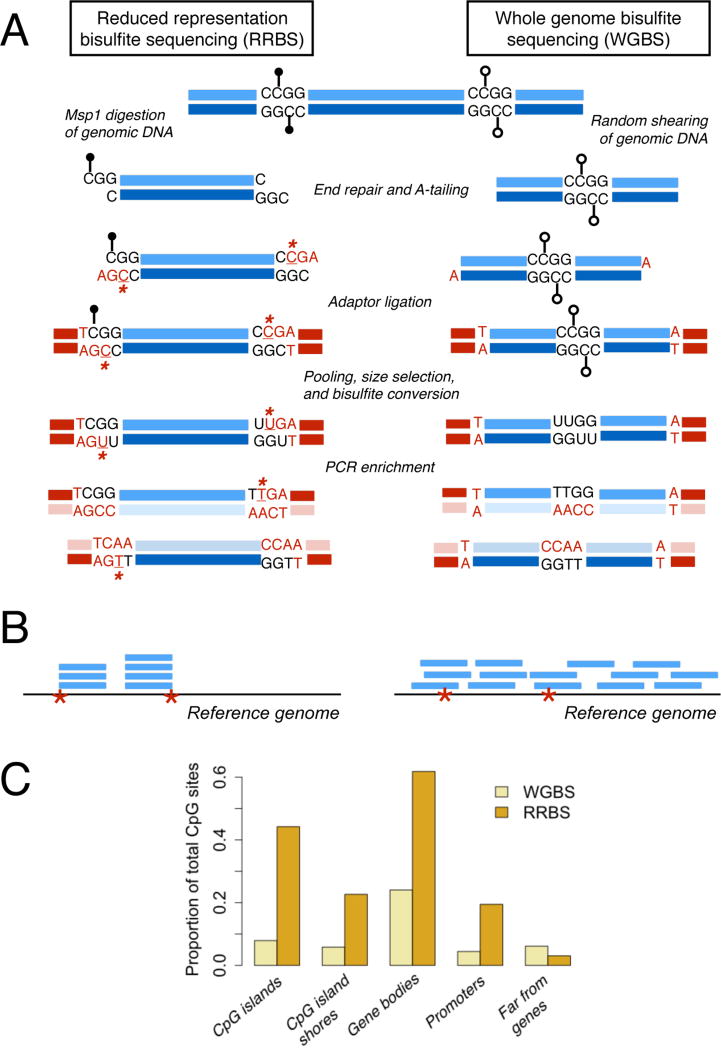
(A) Steps to prepare an RRBS or WGBS library from genomic DNA. Black lollipops: methylated CpG sites; open lollipops: unmethylated CpG sites. Bases introduced during library preparation due to end repair or A-tailing are colored red; unmethylated cytosines that can be used to estimate conversion efficiency are underlined and marked with an asterisk. RRBS fragments start and end with the Msp1 digest sites (CCGG) flanking the initial piece of genomic DNA. (B) Read pileups after mapping RRBS and WGBS libraries to a reference (red asterisks=Msp1 digestion sites). Reads from RRBS libraries cover a small fraction of the genome. Further, because genomic DNA is fragmented with Msp1 and then size selected, all retained fragments should start and end with an Msp1 recognition site and be enriched for CpG sites. Sequencing reads that are shorter than the original fragment length will localize to the Msp1 recognition site associated with either the 5’ or 3’ end of the original fragment. (C) Bar charts compare the proportion of measured CpG sites that fall in gene bodies (between the TSS and the TES), promoters (2 kb upstream of the TSS), CpG islands, and regions far from genes (>100 kb from any annotated TSS or TES) in simulated RRBS and WGBS experiments given the same sequencing effort (20 million reads; read depths commonly used in WGBS studies typically exceed those of RRBS studies, however).
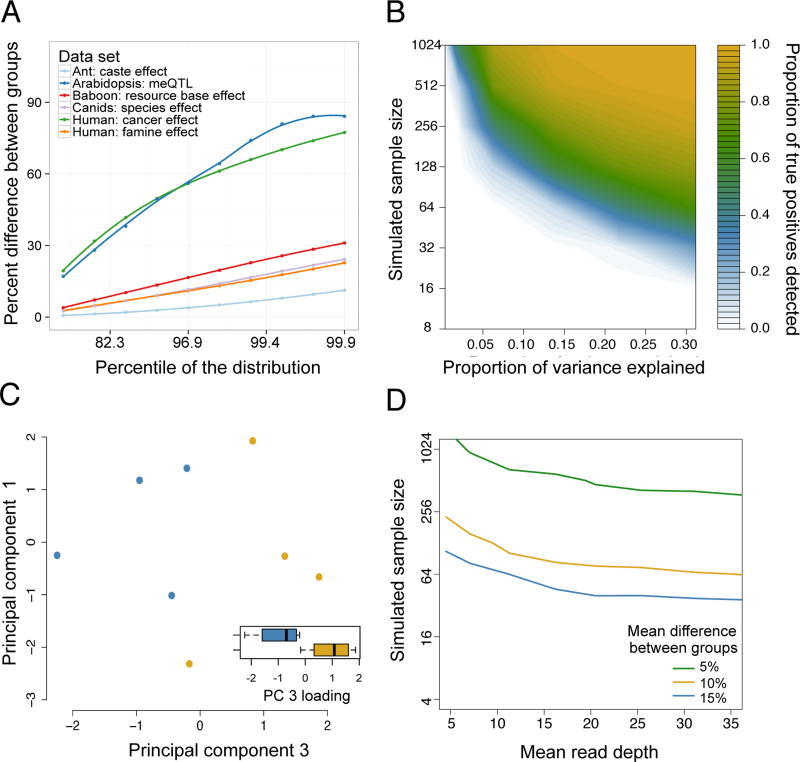
(A) The maximum percent difference in mean DNA methylation levels between two sample groups (y-axis), for selected percentiles of sites (x-axis, ranked from smallest to largest percent difference) in reanalyzed data sets (Table 1) with binary predictor variables. Mean differences are based on raw values, without correction for covariates. We show the largest percentiles here because those effects are most likely to be detected and of interest. (B) Power to detect differentially methylated sites at a 5% FDR in simulated RRBS datasets (sample size is plotted on a log scale). The magnitude of the effect of interest on DNA methylation levels (x-axis) is represented as the proportion of variance explained. (C) In a small ant data set (n=8), site-by-site analyses are underpowered to detect differential methylation between reproductive phase (blue dots) versus brood care phase (yellow dots) individuals, but PCA separates samples by caste (t-test for PC 3, which explains 21.7% of the overall variance: p = 0.022). In 1000 permutations, only 8.8% of permutations separate as cleanly on any of the first five PCs, suggesting that the original analysis was power-limited. Whiskers on boxplots represent the values for the third and first quartiles, plus or minus 1.5× the interquartile range, respectively. (D) The sample size and mean read depth combinations required to achieve 25% power (i.e., detect 25% true positives) in simulated RRBS datasets, for 3 different effect sizes. Increases in read depth do not affect power beyond ~20× coverage, and sample size or effect size increases always increase power more (Supplementary Figure 5).
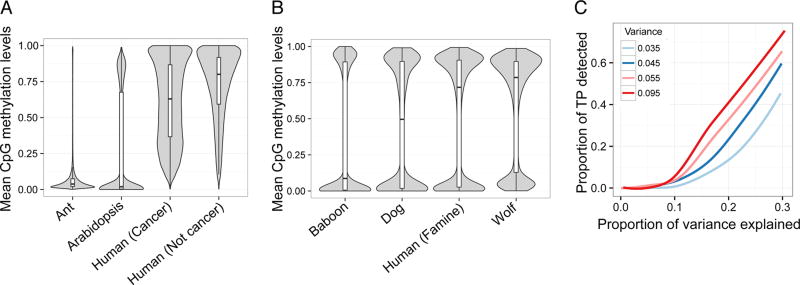
For each (A) WGBS and (B) RRBS data set, we plotted the distribution of mean DNA methylation levels at each CpG site with a median coverage >10× across all samples in the study. Whiskers on boxplots represent the values for the third and first quartiles, plus or minus 1.5× the interquartile range, respectively. (C) Power to detect differentially methylated sites (at a 5% FDR) in simulated RRBS datasets. The proportion of simulated true positives (TP) detected is plotted on the y-axis. Power increases as a function of the simulated effect size (represented as the proportion of variance explained; x-axis) and the variance in DNA methylation levels (colors). For all simulations, mean DNA methylation levels were held constant. The levels of variance in DNA methylation levels explored here (0.035, 0.045, 0.055, and 0.095) represent common values observed in real bisulfite sequencing data sets (Supplementary Figure 7).
References
-
- Feil R, Fraga MF. Epigenetics and the environment: emerging patterns and implications. Nat. Rev. Genet. 2011;13:97–109. - PubMed
-
- Jones P. Functions of DNA methylation: islands, start sites, gene bodies and beyond. Nat. Rev. Genet. 2012;13:484–92. - PubMed
-
- Smith ZD, Meissner A. DNA methylation: roles in mammalian development. Nat. Rev. Genet. 2013;14:204–220. - PubMed
-
- Seymour DK, Becker C. The causes and consequences of DNA methylome variation in plants. Curr. Opin. Plant Biol. 2017;36:56–63. - PubMed
-
- Verhoeven KJF, Jansen JJ, van Dijk PJ, Biere A. Stress-induced DNA methylation changes and their heritability in asexual dandelions. New Phytol. 2010;185:1108–1118. - PubMed
Publication types
MeSH terms
Substances
Grants and funding
LinkOut - more resources
Full Text Sources
Other Literature Sources
