

Natural variation in brain gene expression profiles of aggressive and nonaggressive individual sticklebacks
- PMID: 29046592
- PMCID: PMC5642941
- DOI: 10.1163/1568539X-00003393
Natural variation in brain gene expression profiles of aggressive and nonaggressive individual sticklebacks
Abstract
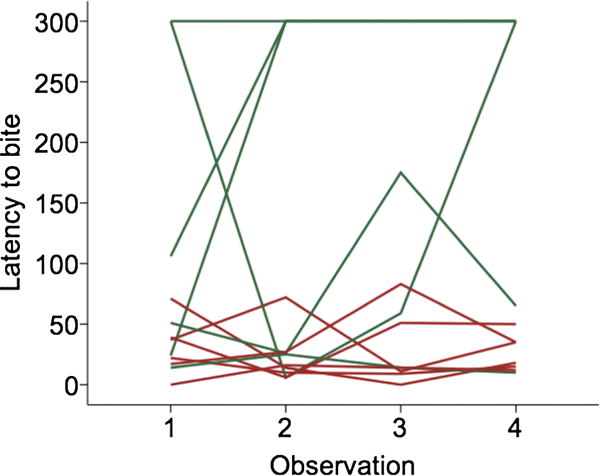
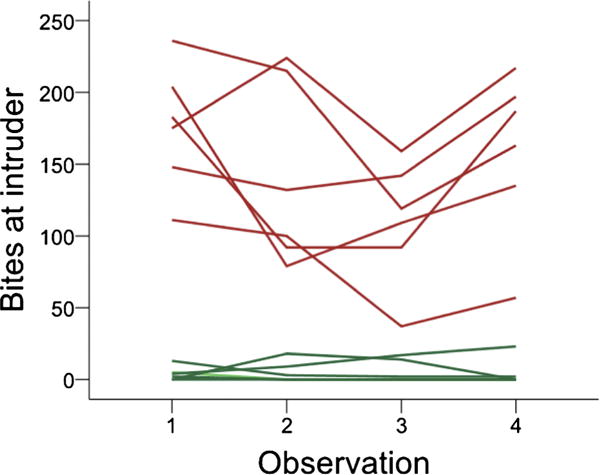
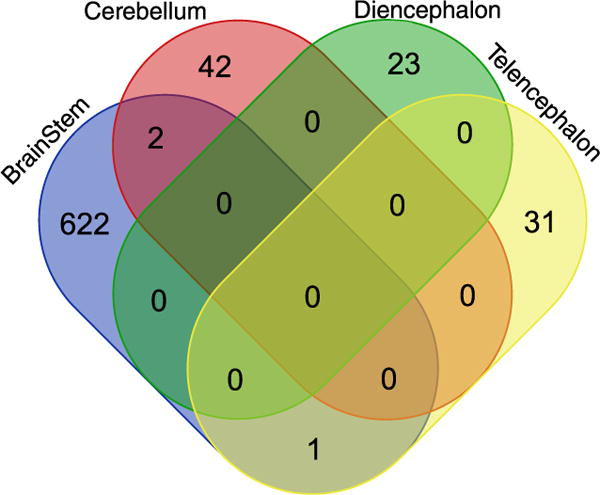
Within many species, some individuals are consistently more aggressive than others. We examine whether there are differences in brain gene expression between aggressive versus nonaggressive behavioural types of individuals within a natural population of male three-spined sticklebacks (Gasterosteus aculeatus). We compared gene expression profiles of aggressive male sticklebacks to nonaggressive males in four regions of the brain (brainstem, cerebellum, diencephalon and telencephalon). Relatively few genes were differentially expressed between behavioural types in telencephalon, cerebellum and diencephalon, but hundreds of genes were differentially expressed in brainstem, a brain area involved in detecting threats. Six genes that were differentially expressed in response to a territorial intrusion in a previous study were also differentially expressed between behavioural types in this study, implying primarily non-shared but some shared molecular mechanisms. Our findings offer new insights into the molecular causes and correlates of behavioural plasticity and individual variation in behaviour.
Keywords: animal personality; behavioural syndromes; sociogenomics.
Figures
Similar articles
-
Molecular mechanisms and the conflict between courtship and aggression in three-spined sticklebacks.Mol Ecol. 2016 Sep;25(17):4368-76. doi: 10.1111/mec.13766. Epub 2016 Aug 26. Mol Ecol. 2016. PMID: 27452346 Free PMC article.
-
Exposure to predation generates personality in threespined sticklebacks (Gasterosteus aculeatus).Ecol Lett. 2007 Sep;10(9):828-34. doi: 10.1111/j.1461-0248.2007.01081.x. Ecol Lett. 2007. PMID: 17663716
-
Individual variation in habituation: behaviour over time toward different stimuli in threespine sticklebacks (Gasterosteus aculeatus).Behaviour. 2012 Jan 1;149(13-14):1339-1365. doi: 10.1163/1568539X-00003019. Behaviour. 2012. PMID: 25678715 Free PMC article.
-
Individual differences in behavioural plasticities.Biol Rev Camb Philos Soc. 2016 May;91(2):534-67. doi: 10.1111/brv.12186. Epub 2015 Apr 10. Biol Rev Camb Philos Soc. 2016. PMID: 25865135 Review.
-
Effects of environmental variation on host-parasite interaction in three-spined sticklebacks (Gasterosteus aculeatus).Zoology (Jena). 2016 Aug;119(4):375-83. doi: 10.1016/j.zool.2016.05.008. Epub 2016 May 26. Zoology (Jena). 2016. PMID: 27289265 Review.
Cited by
-
Nest construction and presence do not alter territorial aggression in male threespine stickleback.Anim Behav. 2020 Aug;166:9-17. doi: 10.1016/j.anbehav.2020.05.010. Epub 2020 Jul 4. Anim Behav. 2020. PMID: 32655149 Free PMC article.
-
Constitutive gene expression differs in three brain regions important for cognition in neophobic and non-neophobic house sparrows (Passer domesticus).PLoS One. 2022 May 10;17(5):e0267180. doi: 10.1371/journal.pone.0267180. eCollection 2022. PLoS One. 2022. PMID: 35536842 Free PMC article.
-
Genomic tools for behavioural ecologists to understand repeatable individual differences in behaviour.Nat Ecol Evol. 2018 Jun;2(6):944-955. doi: 10.1038/s41559-017-0411-4. Epub 2018 Feb 12. Nat Ecol Evol. 2018. PMID: 29434349 Free PMC article. Review.
-
Relating quantitative variation within a behavior to variation in transcription.Evolution. 2017 Aug;71(8):1999-2009. doi: 10.1111/evo.13273. Epub 2017 Jun 8. Evolution. 2017. PMID: 28542920 Free PMC article.
-
Brain de novo transcriptome assembly of a toad species showing polymorphic anti-predatory behavior.Sci Data. 2022 Oct 13;9(1):619. doi: 10.1038/s41597-022-01724-5. Sci Data. 2022. PMID: 36229462 Free PMC article.
References
-
- Alexa A, Rahnenfuhrer J. topGO: topGO: enrichment analysis for gene ontology. R Foundation for Statistical Computing; Vienna: 2010. (R package version 2.22.0).
-
- Anholt RR, Mackay TF. Genetics of aggression. Annu Rev Genet. 2012;46:145–164. - PubMed
-
- Arnold C, Taborsky B. Social experience in early ontogeny has lasting effects on social skills in cooperatively breeding cichlids. Anim Behav. 2010;79:621–630.
-
- Aubin-Horth N, Deschenes M, Cloutier S. Natural variation in the molecular stress network correlates with a behavioural syndrome. Horm Behav. 2012;61:140–146. - PubMed
Grants and funding
LinkOut - more resources
Full Text Sources
Other Literature Sources