. 2017 Oct 4:8:771.
doi: 10.3389/fphys.2017.00771. eCollection 2017.

Computational Cardiac Modeling Reveals Mechanisms of Ventricular Arrhythmogenesis in Long QT Syndrome Type 8: CACNA1C R858H Mutation Linked to Ventricular Fibrillation

Affiliations

Computational Cardiac Modeling Reveals Mechanisms of Ventricular Arrhythmogenesis in Long QT Syndrome Type 8: CACNA1C R858H Mutation Linked to Ventricular Fibrillation

Jieyun Bai et al. Front Physiol. .

Abstract

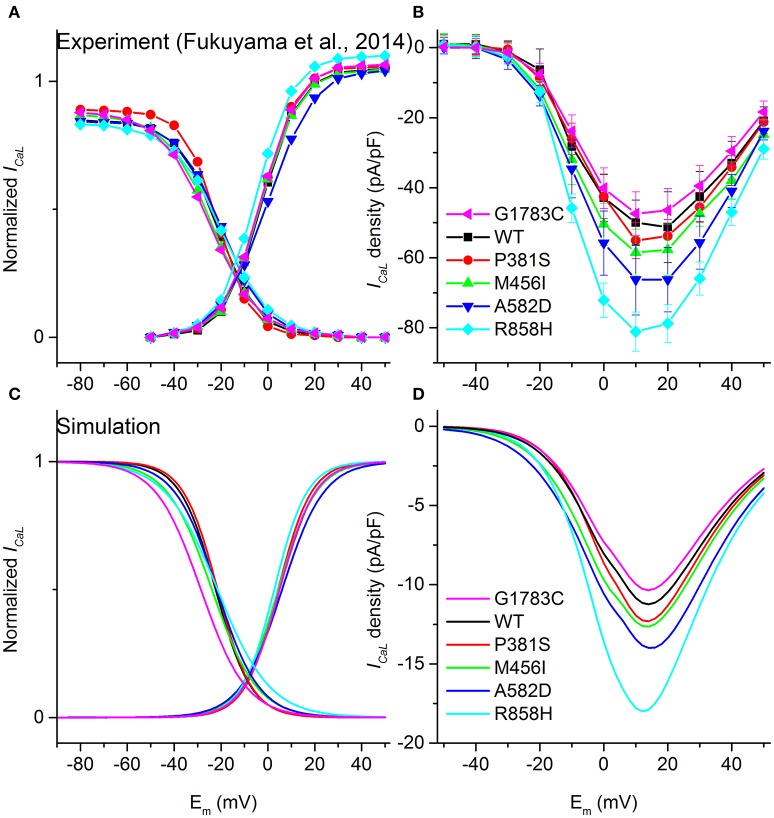
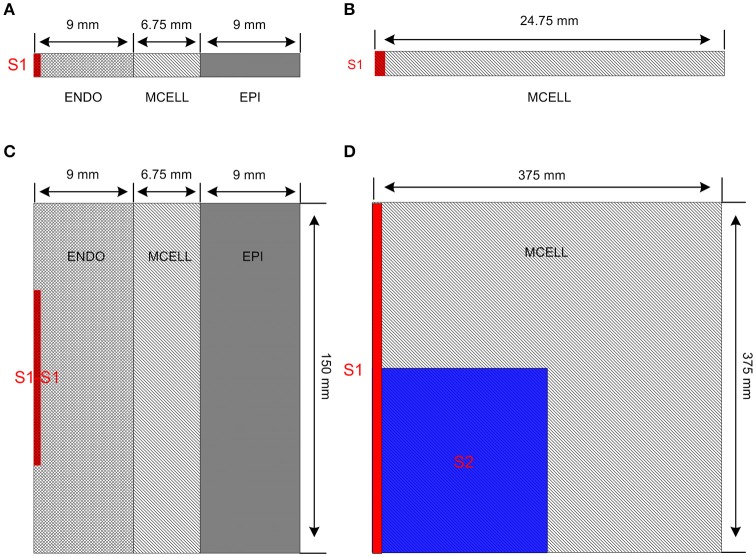
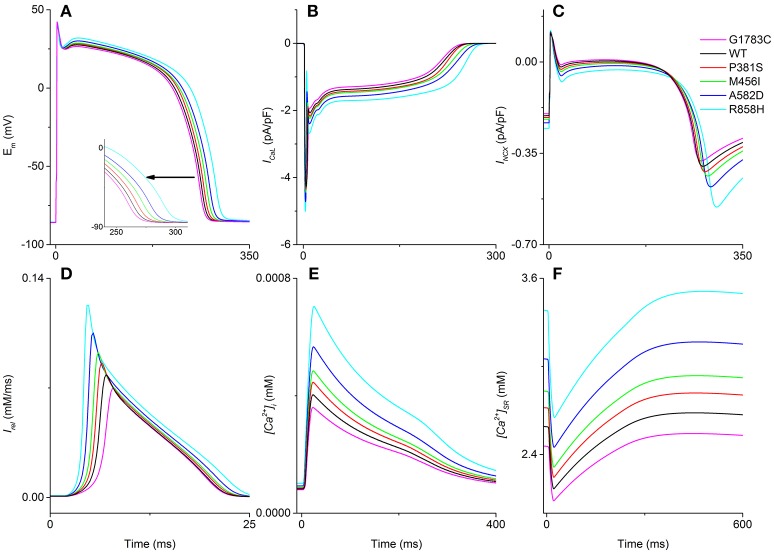
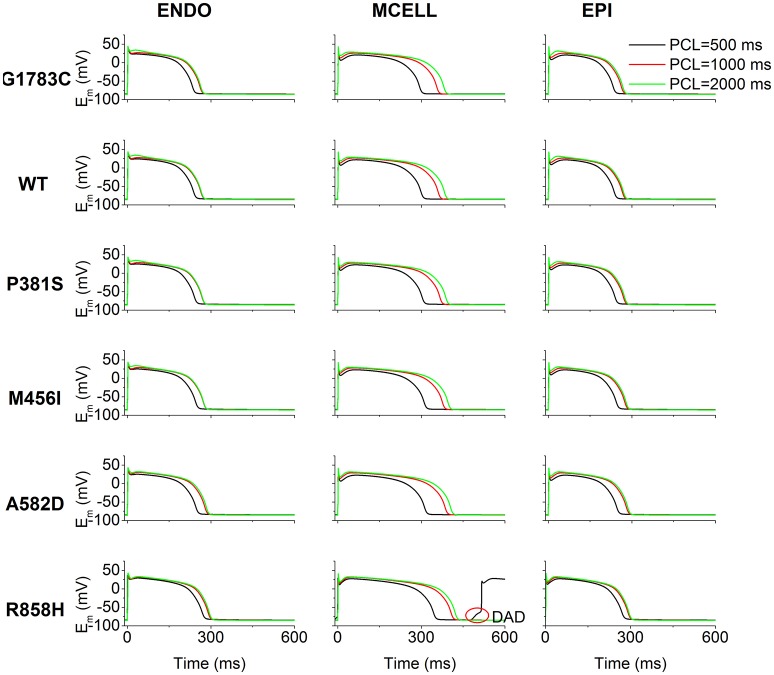
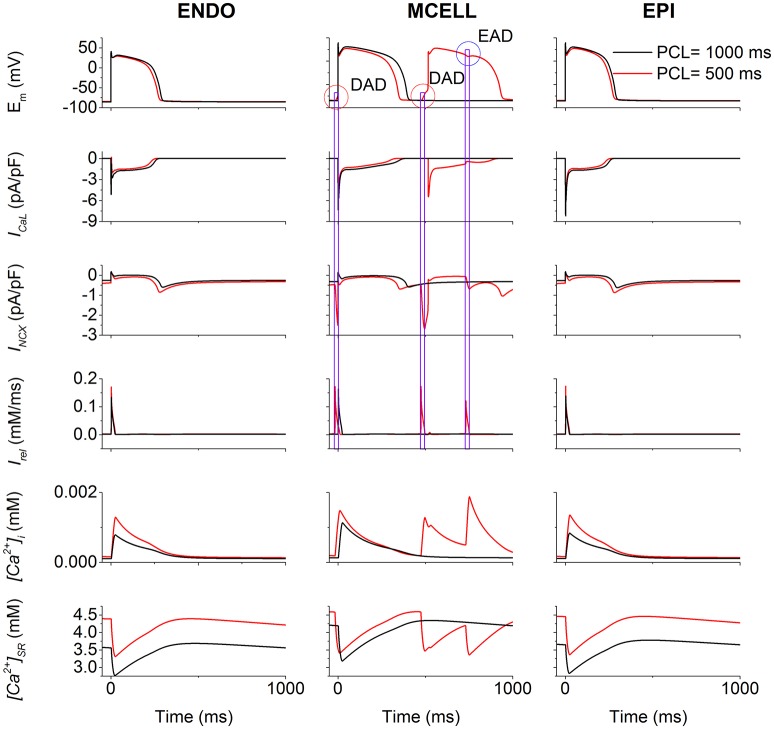
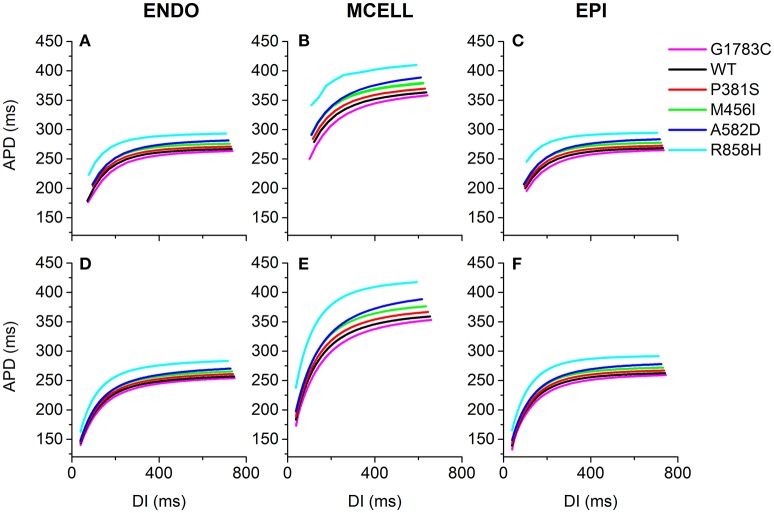
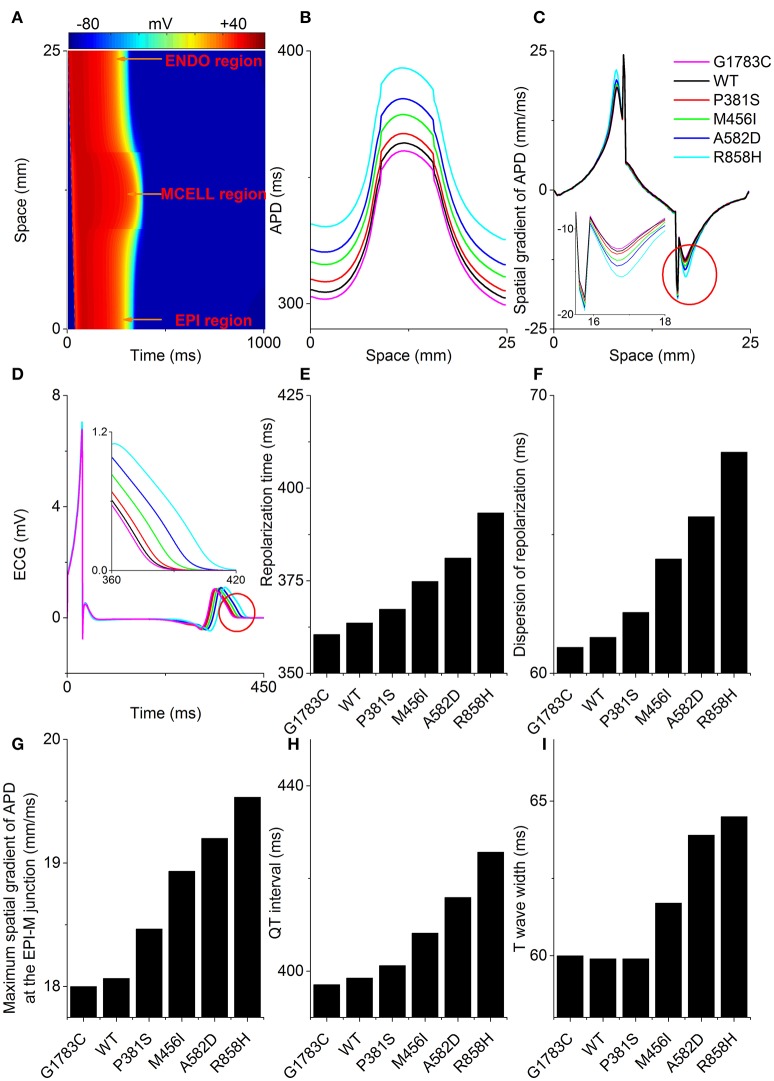
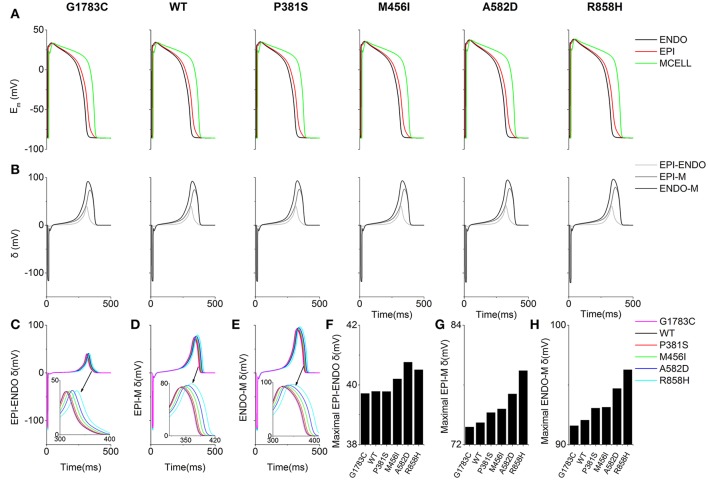
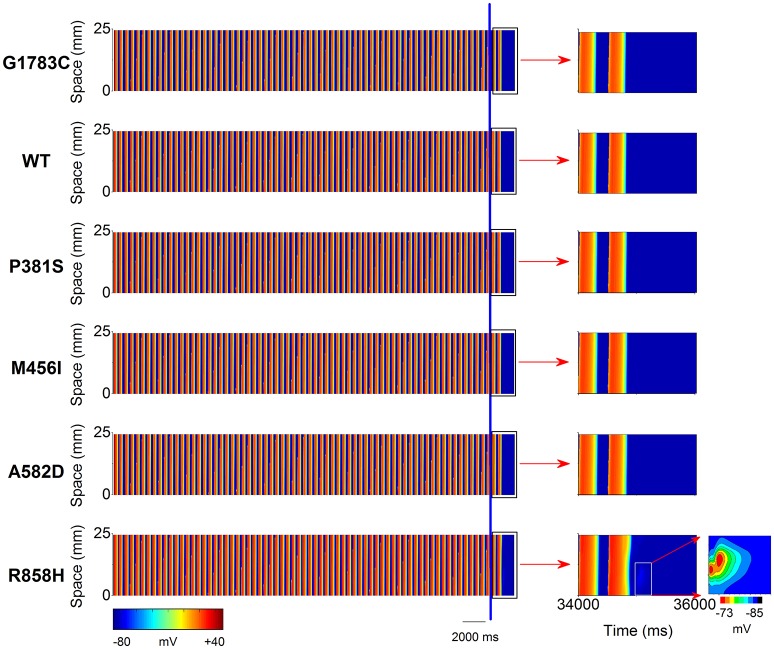
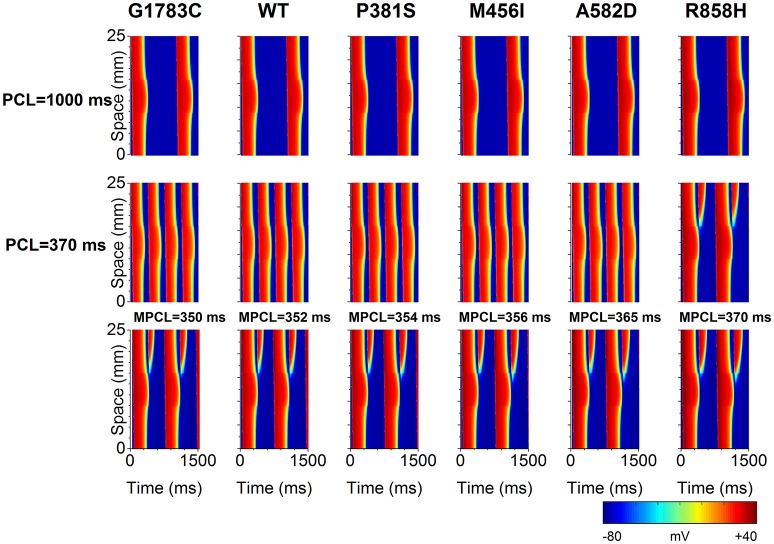
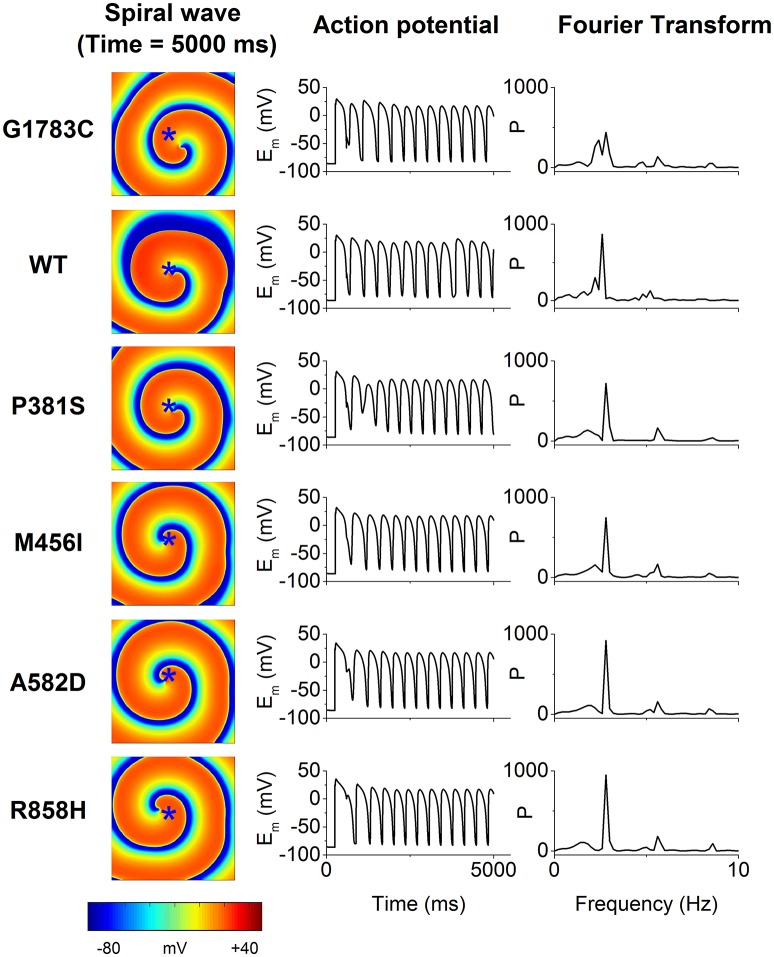
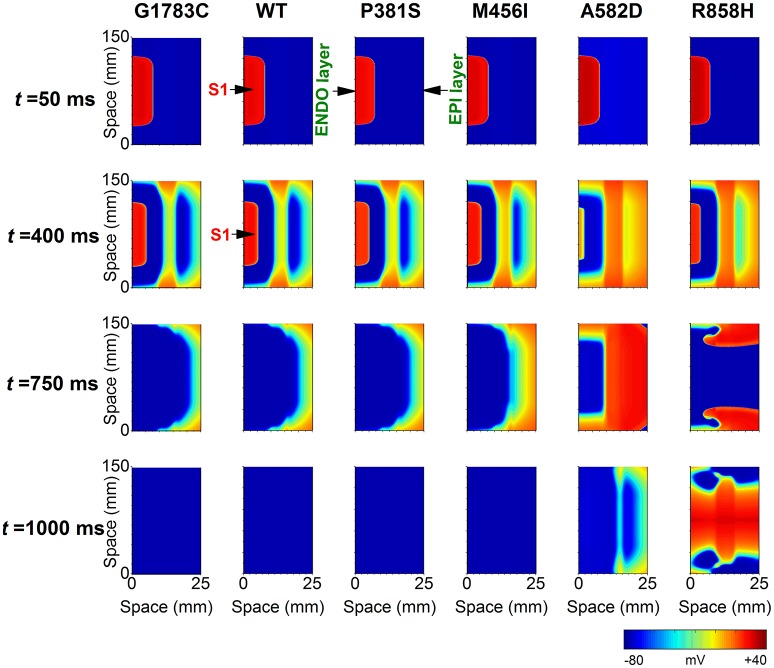
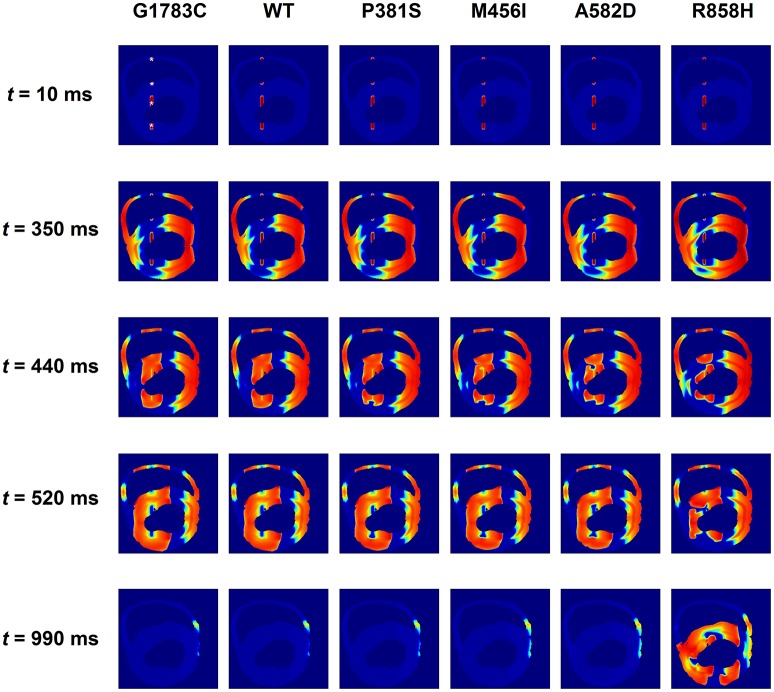
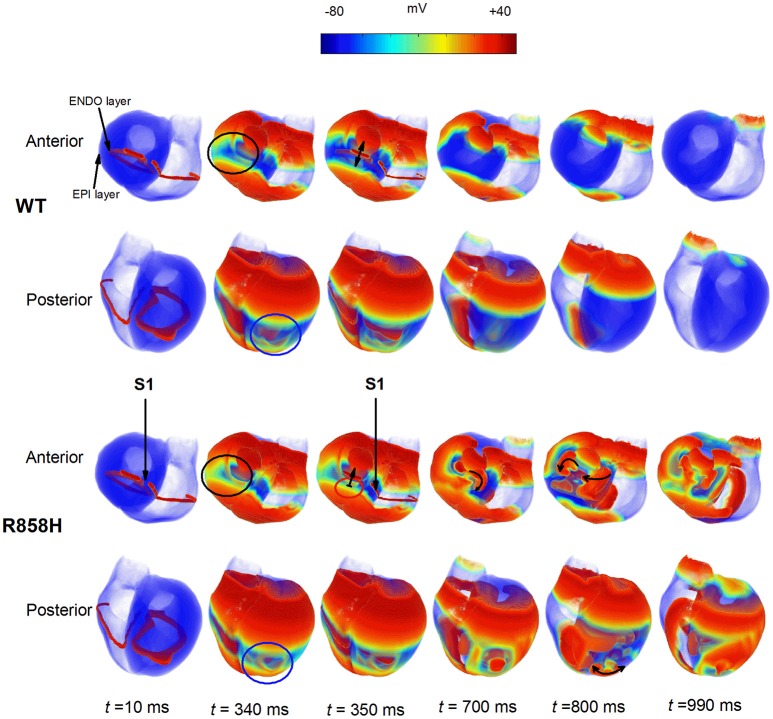
Functional analysis of the L-type calcium channel has shown that the CACNA1C R858H mutation associated with severe QT interval prolongation may lead to ventricular fibrillation (VF). This study investigated multiple potential mechanisms by which the CACNA1C R858H mutation facilitates and perpetuates VF. The Ten Tusscher-Panfilov (TP06) human ventricular cell models incorporating the experimental data on the kinetic properties of L-type calcium channels were integrated into one-dimensional (1D) fiber, 2D sheet, and 3D ventricular models to investigate the pro-arrhythmic effects of CACNA1C mutations by quantifying changes in intracellular calcium handling, action potential profiles, action potential duration restitution (APDR) curves, dispersion of repolarization (DOR), QT interval and spiral wave dynamics. R858H "mutant" L-type calcium current (ICaL ) augmented sarcoplasmic reticulum calcium content, leading to the development of afterdepolarizations at the single cell level and focal activities at the tissue level. It also produced inhomogeneous APD prolongation, causing QT prolongation and repolarization dispersion amplification, rendering R858H "mutant" tissue more vulnerable to the induction of reentry compared with other conditions. In conclusion, altered ICaL due to the CACNA1C R858H mutation increases arrhythmia risk due to afterdepolarizations and increased tissue vulnerability to unidirectional conduction block. However, the observed reentry is not due to afterdepolarizations (not present in our model), but rather to a novel blocking mechanism.

Keywords: CACNA1C mutations; L-type calcium channel; Long QT syndrome; Timothy syndrome; computational cardiac modeling; dispersion of repolarization; ventricular fibrillation.


Figures

Figure 1
Figure 1
Voltage-dependence of activation and inactivation kinetics for G1783C (Magenta), wild-type (WT, Black), P381S (Red), M456I (Green), A582D (Blue), and R858H (Cyan) conditions. Activation and inactivation curves obtained from experimental data (A) as well as simulated results (C) are shown. Current-voltage (I–V) relationships obtained from experiments (B) and simulations (D) are compared.
Figure 2
Figure 2
Multicellular one-dimensional (1D) and 2D tissue models. (A) A 1D transmural ventricular cable of 24.75 mm which contains 9 mm long endocardial region (ENDO), 6.75 mm long midmyocardial region (MCELL) and 9 mm long epicardial region (EPI). The S1 stimulus is applied to a 0.45 mm ENDO region. (B) A 1D homogeneous ventricular cable of 24.75 mm with MCELL cells is constructed and the S1 stimulus is applied to a 0.45 mm region at the end of the cable. (C) A 2D transmural ventricular model was constructed by expanding the 1D transmural fiber into a sheet with a length of 150 mm and a width of 24.75 mm. The S1-S1 stimulation is applied to the 0.45 × 75 mm2 region at the left side of the ENDO layer. (D) A 375 × 375 mm2 homogeneous tissue with MCELL cells was developed. Location of S1stimulation (Red) and region of S2 stimulation (Blue) are shown.
Figure 3
Figure 3
Intracellular calcium handling and action potential. For endocardial cells, time courses of the membrane potential (Em, A), the L-type calcium current (ICaL, B), the sodium-calcium exchanger current (INCX, C), calcium induced calcium release flux (Irel, D), cytoplasmic calcium concentration ([Ca2+]i, E) and sarcoplasmic reticulum (SR) calcium concentration ([Ca2+]SR, F) in the G1783C (Magenta), wild-type (WT, Black), P381S (Red), M456I (Green), A582D (Blue), and R858H (Cyan) conditions are shown. The pacing cycle length (PCL) used in these simulations is 1,000 ms. Action potential duration, INCX, Irel, [Ca2+]i, and [Ca2+]SR augment with an increase in ICaL. Changes in action potential duration are indicated by an enlargement of the (A).
Figure 4
Figure 4
Simulated action potentials (Em) for the Ten Tusscher-Panfilov (TP06) human ventricular cell model at different pacing cycle lengths (PCL) under G1783C, wild-type (WT), P381S, M456I, A582D, and R858H conditions. Endocardial (ENDO, left column), midmyocardial (MCELL, middle column) and epicardial (EPI, right column) action potentials at the PCL of 500 (Black), 1,000 (Red), and 2,000 ms (Green), respectively. Action potential duration abbreviates with a decrease in PCL. For each mutation, action potential duration of MCELL cells is longer than that of other cells. Among in these mutations, when the PCL is 500 ms for R858H, delayed afterdepolarizations (DAD, marked with a red circle) were triggered in MCELL cells.
Figure 5
Figure 5
Effects of the R858H L-type calcium current (ICaL) on the induction of afterdepolarizations. For endocardial (ENDO, left column), midmyocardial (MCELL, middle column) and epicardial (EPI, right column) cells, time courses of membrane potential (Em), underlying L-type calcium current (ICaL), the sodium-calcium exchanger current (INCX), calcium induced calcium release flux (Irel), cytoplasmic calcium concentration ([Ca2+]i) as well as sarcoplasmic reticulum (SR) calcium concentration ([Ca2+]SR) at the pacing cycle length (PCL) of 500 (Red) and 1,000 ms (Black), respectively. Among different cell types, in MCELL cells early afterdepolarizations (EAD, marked with a blue circle) and delayed afterdepolarizations (DAD, marked with a red circle) occurred at the PCL of 500 ms. These afterdepolarizations were triggered by Irel via INCX.
Figure 6
Figure 6
Single-cell action potential duration (APD) restitution (APDR) curves for the Ten Tusscher-Panfilov (TP06) human ventricular cell model. (A–C) APDR curves obtained using a dynamic restitution protocol for the endocardial (ENDO), epicardial (EPI) and midmyocardial (MCELL) cells in the G1783C (Magenta), wild-type (WT, Black), P381S (Red), M456I (Green), A582D (Blue), and R858H (Cyan) conditions. (D–F) Similar dynamic restitution curves as in (A–C), but these APDR curves obtained using a S1-S2 restitution protocol for a pacing cycle length (PCL) of 1,000 ms for the six different settings. APD is plotted against diastolic interval (DI). For each cell type, curves from bottom to top are for the G1783C mutation, for the WT condition, for the P381S mutation, for the M456I mutation, for the A582D mutation and for the R858H mutation, respectively. Among in these mutations, the R858H mutation obviously shifts APDR curves upwards.
Figure 7
Figure 7
Space-time plot of action potential propagation and the computed pseudo-ECG. (A) Color mapping of membrane potential of cells along the one-dimensional (1D) strand from blue (−86 mV) to red (+42 mV). Space runs from the endocardial (ENDO) region to the midmyocardial (MCELL) and epicardial (EPI) regions. Spatial distribution of action potential duration (APD, B), spatial gradient of APD (C), and pseudo-ECGs (D) corresponding to the G1783C (Magenta), wild-type (WT, Black), P381S (Red), M456I (Green), A582D (Blue), and R858H (Cyan) conditions, respectively. Computed repolarization time (RT, E), dispersion of repolarization (DOR, F), maximum spatial gradient of APD (MSGA) at the epicardial- and midmyocardial- (EPI-M) junction (G), QT interval (H) and T wave width (I) are shown. From bottom to top, curves for the spatial distribution of APD are for the G1783C mutation, for the WT condition, for the P381S mutation, for the M456I mutation, for the A582D mutation and for the R858H mutation, respectively. Changes in the spatial gradient of APD at the EPI-M junction (marked with a red circle) are indicated by an enlargement of the (C). Changes in the T wave (marked with a red circle) are indicated by an enlargement of the (D). RT, DOR, MSGA at the EPI-M junction and QT interval augment with an increase in APD. T wave widths show no apparent differences between G1783C, WT and P381S.
Figure 8
Figure 8
Membrane potential heterogeneity (δ) for EPI-ENDO (between epicaridal and endocardial cells), EPI-M (between epicaridal and midmyocardial cells) and ENDO-M (between endocaridal and midmyocardial cells) in a one-dimensional (1D) transmural ventricular cable. (A) Endocardial (ENDO, Black), epicardial (EPI, Red), and midmyocardial (MCELL, Green) membrane potentials (Em) for the G1783C, wild-type (WT), P381S, M456I, A582D and R858H conditions. (B) EPI-ENDO (Light Gray), EPI-M (Gray) and ENDO-M δ (Dark Gray). (C–E) Superimposed EPI-ENDO, EPI-M and ENDO-M δ. (F–H) Absolute maximum EPI-ENDO, EPI-M, and ENDO-M δ.
Figure 9
Figure 9
Space-time plots of midmyocardial action potential propagation in a one-dimensional (1D) homogeneous ventricular cable at the pacing cycle length (PCL) of 500 ms. Color mappings of membrane potential (left column) are shown under G1783C, wild-type (WT), P381S, M456I, A582D, and H858R conditions, respectively. The last two beats (the part on the right of the blue line) obtained from 34,000 to 36,000 ms (right column, marked with a black rectangle). A local region (marked with a white rectangle) close to the pacing site exhibiting a subthreshold delayed afterdepolarization (DAD) with no premature ventricular complex (PVC) under the R858H condition. Changes in membrane potential of the local region are indicated by an enlargement of the marked zone. Color mapping of membrane potential from blue (−85 mV) to red (−73 mV).
Figure 10
Figure 10
Space-time plots of action potential propagation in a one-dimensional (1D) transmural ventricular cable at different pacing cycle lengths (PCL). At PCL of 1,000 ms, no conduction block is shown. At PCL of 370 ms, unidirectional conduction block occurs under the R858H condition. When the PCL is decreased, unidirectional conduction block can occur under other conditions. The maximum PCL (MPCL) that produced unidirectional conduction block for G1783C, wild-type (WT), P381S, M456I, A582D, and H858R is 350, 352, 354, 356, 365, and 370 ms, respectively.
Figure 11
Figure 11
The spiral wave (Time = 5,000 ms, left column), action potential (Em, middle column) and temporal Fourier transforms of Em (right column) for the G1783C, wild-type (WT), P381S, M456I, A582D, and R858H conditions. Action potential recorded from a representative point (x = 187.5 mm, y = 187.5 mm) that is marked by an asterisk.
Figure 12
Figure 12
Snapshots of transmural conduction of electrical waves in a 24.75 × 150 mm2 transmual ventricular sheet. An electrical wave was elicited by the S1 stimulus applied to a 0.45 × 75 mm2 endocardial (ENDO) region at t = 0 ms and propagated from the ENDO layer to the epicardial (EPI) layer. Snapshot taken at t = 50 ms. Another S1 stimulus applied to the same ENDO region at t = 370 ms generated an electrical wave. Snapshot taken at t = 400 ms. Action potential propagation under G1783C, wild-type (WT), P381S, M456I, A582D, and R858H conditions, respectively. A spiral wave developed under the R858H condition at t = 750 ms. The pacing cycle length (PCL) used in these simulations is 370 ms.
Figure 13
Figure 13
Snapshots of transmural conduction of electrical waves in a transmural ventricular slice. Electrical waves were elicited by the S1 stimulus applied to four endocardial (ENDO) sites (marked with white asterisks). Snapshot taken at t = 10 ms. Another S1 stimulus applied to the same sites at t = 350 ms generated several electrical waves. Action potential propagation under G1783C and wild-type (WT) conditions, local conduction block under P381S, M456I, and A582D conditions, and unidirectional conduction block under the R858H condition. Snapshot taken at t = 440 ms. Several spiral waves developed at t = 520 ms and sustained excitation waves at t = 990 ms under the R858H condition.
Figure 14
Figure 14
Dynamics of electrical waves in 3D human ventricles under wild-type (WT) and R858H conditions. The S1-S1 stimulation was applied to a 2.5 mm wide region of the endocardial (ENDO) layer to investigate the induction of reentry. A conditioning wave was initiated by the S1 stimulus. Snapshots taken at 10 ms. Compared with the R858H condition, the ventricles began to repolarize earlier under the WT condition at 340 ms (marked with a blue circle for the posterior view and a black circle for the anterior view). Another excitation wave initiated by the second S1 stimulus conducted bidirectionally (marked with a bidirectional arrow) under the WT condition whilst local conduction block (marked with unidirectional arrows) occurred (t = 350 ms) and spiral waves (marked with unidirectional arrows) were induced under the R858H condition (t = 700 ms and t = 800 ms). Snapshots for the anterior and posterior views were given. Unrecovered tissues were marked with a red circle and the S1-S1 interval was 348 ms.

Similar articles

Cited by

References

    1. Adler A., van der Werf C., Postema P. G., Rosso R., Bhuiyan Z. A., Kalman J. M., et al. . (2012). The phenomenon of “QT stunning”: the abnormal QT prolongation provoked by standing persists even as the heart rate returns to normal in patients with long QT syndrome. Heart Rhythm 9, 901–908. 10.1016/j.hrthm.2012.01.026 - DOI - PMC - PubMed
    1. Antzelevitch C. (2001). Transmural dispersion of repolarization and the T wave. Cardiovasc. Res. 50, 426–431. 10.1016/S0008-6363(01)00285-1 - DOI - PubMed
    1. Antzelevitch C., Fish J. (2001). Electrical heterogeneity within the ventricular wall. Basic Res. Cardiol. 96, 517–527. 10.1007/s003950170002 - DOI - PubMed
    1. Antzelevitch C., Shimizu W., Yan G. X., Sicouri S. (1998). Cellular basis for QT dispersion. J. Electrocardiol. 30(Suppl.), 168–175. 10.1016/S0022-0736(98)80070-8 - DOI - PubMed
    1. Bai J., Wang K., Zhang H. (2016a). Potential pathogenesis discovery of arrhythmia based on cardiac electrophysiological models: research progress. Prog. Biochem. Biophys. 43, 128–140. 10.16476/j.pibb.2015.0302 - DOI

LinkOut - more resources