

Reclassification of Paenibacillus riograndensis as a Genomovar of Paenibacillus sonchi: Genome-Based Metrics Improve Bacterial Taxonomic Classification
- PMID: 29046663
- PMCID: PMC5632714
- DOI: 10.3389/fmicb.2017.01849
Reclassification of Paenibacillus riograndensis as a Genomovar of Paenibacillus sonchi: Genome-Based Metrics Improve Bacterial Taxonomic Classification
Abstract
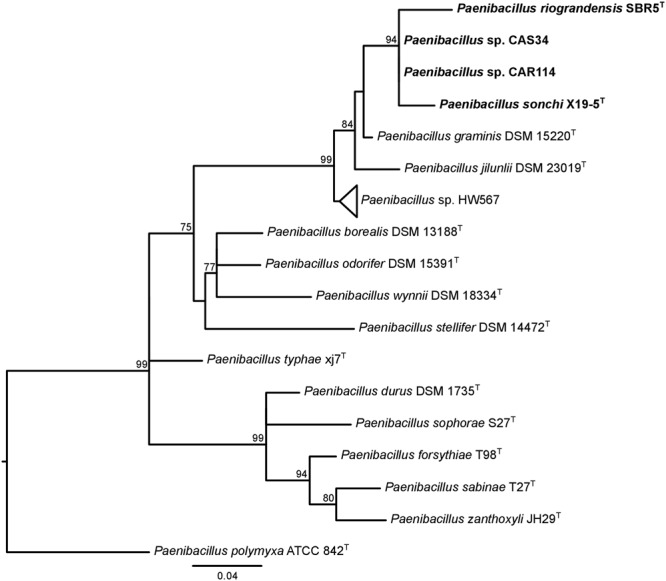
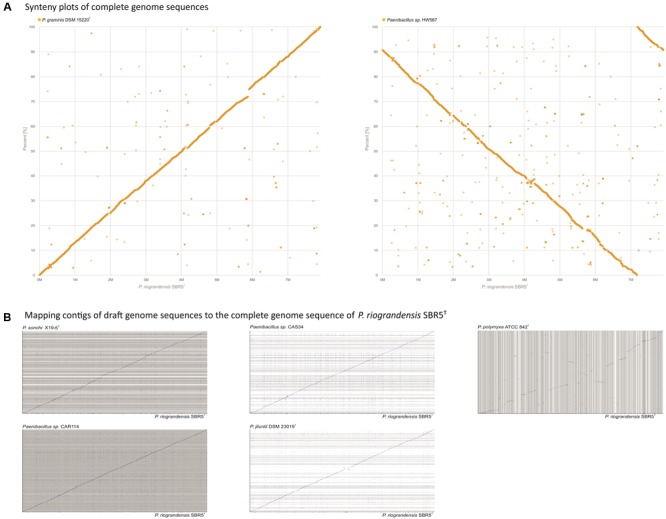
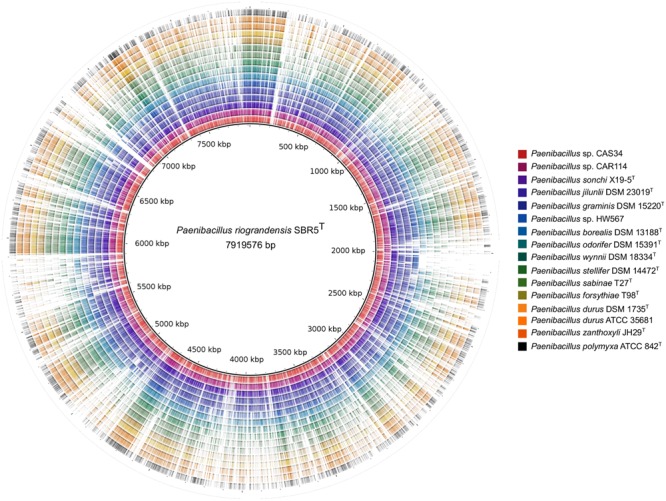
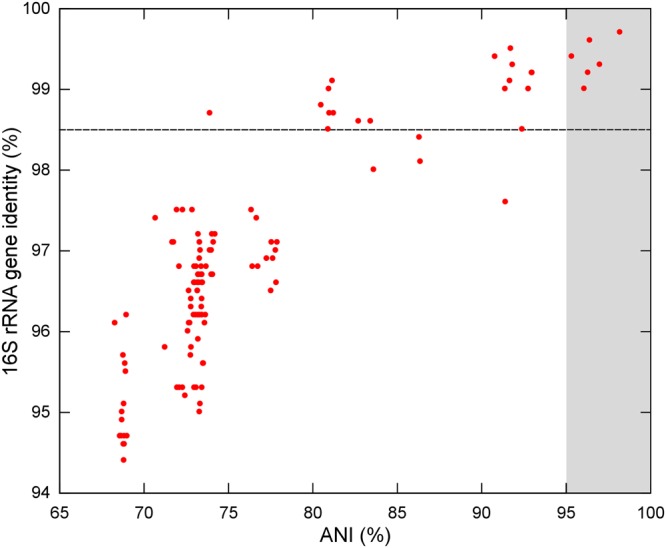
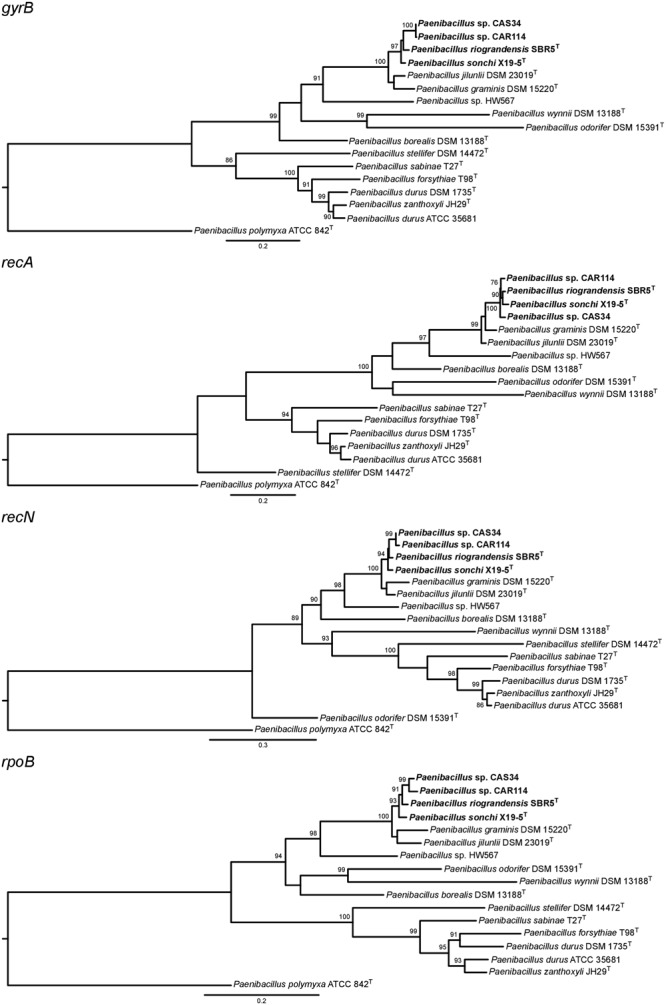
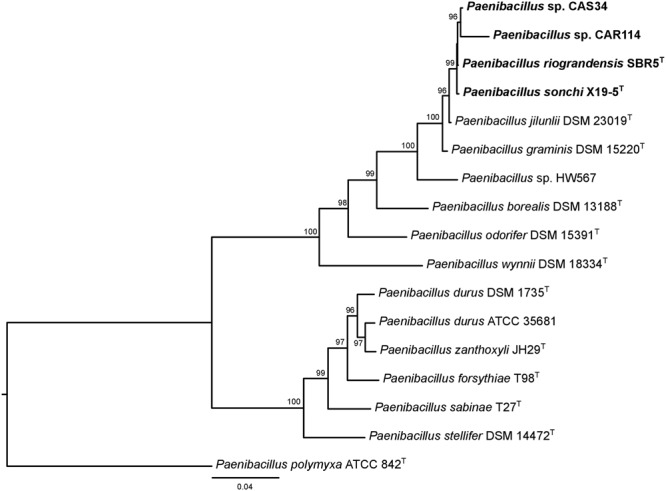
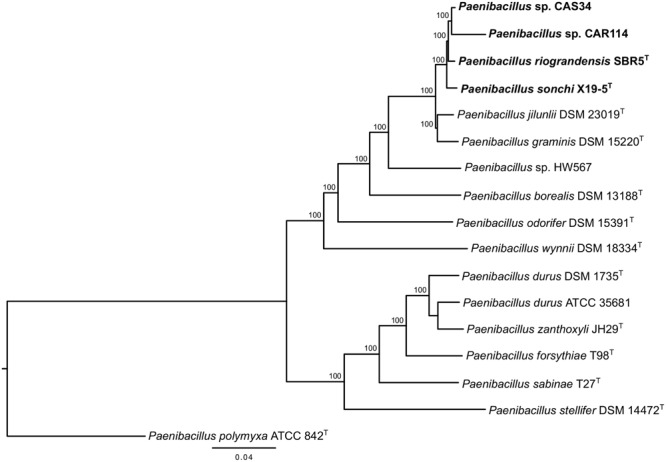
Species from the genus Paenibacillus are widely studied due to their biotechnological relevance. Dozens of novel species descriptions of this genus were published in the last couple of years, but few utilized genomic data as classification criteria. Here, we demonstrate the importance of using genome-based metrics and phylogenetic analyses to identify and classify Paenibacillus strains. For this purpose, Paenibacillus riograndensis SBR5T, Paenibacillus sonchi X19-5T, and their close relatives were compared through phenotypic, genotypic, and genomic approaches. With respect to P. sonchi X19-5T, P. riograndensis SBR5T, Paenibacillus sp. CAR114, and Paenibacillus sp. CAS34 presented ANI (average nucleotide identity) values ranging from 95.61 to 96.32%, gANI (whole-genome average nucleotide identity) values ranging from 96.78 to 97.31%, and dDDH (digital DNA-DNA hybridization) values ranging from 68.2 to 73.2%. Phylogenetic analyses of 16S rRNA, gyrB, recA, recN, and rpoB genes and concatenated proteins supported the monophyletic origin of these Paenibacillus strains. Therefore, we propose to assign Paenibacillus sp. CAR114 and Paenibacillus sp. CAS34 to P. sonchi species, and reclassify P. riograndensis SBR5T as a later heterotypic synonym of P. sonchi (type strain X19-5T), with the creation of three novel genomovars, P. sonchi genomovar Sonchi (type strain X19-5T), P. sonchi genomovar Riograndensis (type strain SBR5T), P. sonchi genomovar Oryzarum (type strain CAS34T = DSM 102041T; = BR10511T).
Keywords: Paenibacillus; Paenibacillus riograndensis; Paenibacillus sonchi; average nucleotide identity; dDDH; phylogeny; taxonomy.
Figures
Similar articles
-
Genome-based reclassification of Paenibacillus dauci as a later heterotypic synonym of Paenibacillus shenyangensis.Int J Syst Evol Microbiol. 2019 Jan;69(1):177-182. doi: 10.1099/ijsem.0.003127. Epub 2018 Nov 21. Int J Syst Evol Microbiol. 2019. PMID: 30461377
-
CRISPR interference-based gene repression in the plant growth promoter Paenibacillus sonchi genomovar Riograndensis SBR5.Appl Microbiol Biotechnol. 2020 Jun;104(11):5095-5106. doi: 10.1007/s00253-020-10571-6. Epub 2020 Apr 9. Appl Microbiol Biotechnol. 2020. PMID: 32274563 Free PMC article.
-
Genomic metrics analyses indicate that Paenibacillus azotofixans is not a later synonym of Paenibacillus durus.Int J Syst Evol Microbiol. 2019 Sep;69(9):2870-2876. doi: 10.1099/ijsem.0.003572. Int J Syst Evol Microbiol. 2019. PMID: 31259683
-
Paenibacillus helianthi sp. nov., a nitrogen fixing species isolated from the rhizosphere of Helianthus annuus L.Antonie Van Leeuwenhoek. 2018 Dec;111(12):2463-2471. doi: 10.1007/s10482-018-1135-4. Epub 2018 Aug 2. Antonie Van Leeuwenhoek. 2018. PMID: 30073429
-
Paenibacillus sonchi sp. nov., a nitrogen-fixing species isolated from the rhizosphere of Sonchus oleraceus.Int J Syst Evol Microbiol. 2009 Nov;59(Pt 11):2656-61. doi: 10.1099/ijs.0.009308-0. Epub 2009 Jul 22. Int J Syst Evol Microbiol. 2009. PMID: 19625436
Cited by
-
Genome-based analyses to learn from and about Paenibacillus sonchi genomovar Riograndensis SBR5T.Genet Mol Biol. 2024 Jan 5;46(3 Suppl 1):e20230115. doi: 10.1590/1678-4685-GMB-2023-0115. eCollection 2024. Genet Mol Biol. 2024. PMID: 38224489 Free PMC article.
-
Comparative Genomics Insights into a Novel Biocontrol Agent Paenibacillus peoriae Strain ZF390 against Bacterial Soft Rot.Biology (Basel). 2022 Aug 4;11(8):1172. doi: 10.3390/biology11081172. Biology (Basel). 2022. PMID: 36009799 Free PMC article.
-
Enterococci from Wild Magellanic Penguins (Spheniscus magellanicus) as an Indicator of Marine Ecosystem Health and Human Impact.Appl Environ Microbiol. 2020 Sep 17;86(19):e01662-20. doi: 10.1128/AEM.01662-20. Print 2020 Sep 17. Appl Environ Microbiol. 2020. PMID: 32737129 Free PMC article.
-
Genomic Metrics Applied to Rhizobiales (Hyphomicrobiales): Species Reclassification, Identification of Unauthentic Genomes and False Type Strains.Front Microbiol. 2021 Mar 25;12:614957. doi: 10.3389/fmicb.2021.614957. eCollection 2021. Front Microbiol. 2021. PMID: 33841347 Free PMC article.
-
Inorganic Phosphate Solubilization by Rhizosphere Bacterium Paenibacillus sonchi: Gene Expression and Physiological Functions.Front Microbiol. 2020 Dec 14;11:588605. doi: 10.3389/fmicb.2020.588605. eCollection 2020. Front Microbiol. 2020. PMID: 33424789 Free PMC article.
References
-
- Ambrosini A., Beneduzi A., Stefanski T., Pinheiro F. G., Vargas L. K., Passaglia L. M. P. (2012). Screening of plant growth promoting Rhizobacteria isolated from sunflower (Helianthus annuus L.). Plant Soil 356 245–264. 10.1007/s11104-011-1079-1 - DOI
-
- Ambrosini A., Stefanski T., Lisboa B. B., Beneduzi A., Vargas L. K., Passaglia L. M. P. (2015). Diazotrophic bacilli isolated from the sunflower rhizosphere and the potential of Bacillus mycoides B38V as biofertiliser. Ann. Appl. Biol. 168 93–110. 10.1111/aab.12245 - DOI
LinkOut - more resources
Full Text Sources
Other Literature Sources
Molecular Biology Databases