. 2017 Oct 4:8:1210.
doi: 10.3389/fimmu.2017.01210. eCollection 2017.

Interpreting T-Cell Cross-reactivity through Structure: Implications for TCR-Based Cancer Immunotherapy

Affiliations

Interpreting T-Cell Cross-reactivity through Structure: Implications for TCR-Based Cancer Immunotherapy

Dinler A Antunes et al. Front Immunol. .

Abstract

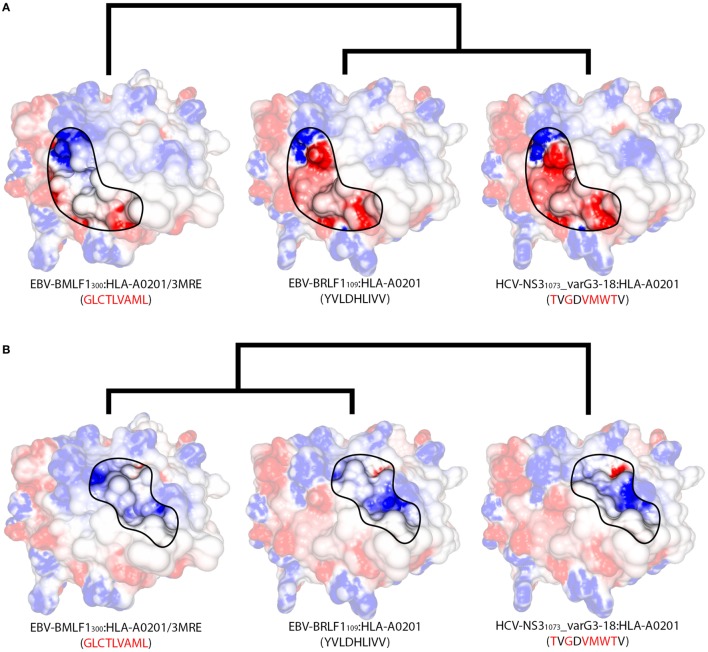
Immunotherapy has become one of the most promising avenues for cancer treatment, making use of the patient's own immune system to eliminate cancer cells. Clinical trials with T-cell-based immunotherapies have shown dramatic tumor regressions, being effective in multiple cancer types and for many different patients. Unfortunately, this progress was tempered by reports of serious (even fatal) side effects. Such therapies rely on the use of cytotoxic T-cell lymphocytes, an essential part of the adaptive immune system. Cytotoxic T-cells are regularly involved in surveillance and are capable of both eliminating diseased cells and generating protective immunological memory. The specificity of a given T-cell is determined through the structural interaction between the T-cell receptor (TCR) and a peptide-loaded major histocompatibility complex (MHC); i.e., an intracellular peptide-ligand displayed at the cell surface by an MHC molecule. However, a given TCR can recognize different peptide-MHC (pMHC) complexes, which can sometimes trigger an unwanted response that is referred to as T-cell cross-reactivity. This has become a major safety issue in TCR-based immunotherapies, following reports of melanoma-specific T-cells causing cytotoxic damage to healthy tissues (e.g., heart and nervous system). T-cell cross-reactivity has been extensively studied in the context of viral immunology and tissue transplantation. Growing evidence suggests that it is largely driven by structural similarities of seemingly unrelated pMHC complexes. Here, we review recent reports about the existence of pMHC "hot-spots" for cross-reactivity and propose the existence of a TCR interaction profile (i.e., a refinement of a more general TCR footprint in which some amino acid residues are more important than others in triggering T-cell cross-reactivity). We also make use of available structural data and pMHC models to interpret previously reported cross-reactivity patterns among virus-derived peptides. Our study provides further evidence that structural analyses of pMHC complexes can be used to assess the intrinsic likelihood of cross-reactivity among peptide-targets. Furthermore, we hypothesize that some apparent inconsistencies in reported cross-reactivities, such as a preferential directionality, might also be driven by particular structural features of the targeted pMHC complex. Finally, we explain why TCR-based immunotherapy provides a special context in which meaningful T-cell cross-reactivity predictions can be made.

Keywords: T-cell cross-reactivity; TCR-interacting surface; TCR/pMHC; cancer immunotherapy; cross-reactivity hot-spots; hierarchical clustering; peptide–MHC complex.


Figures

Figure 1
Figure 1
Cross-reactivity networks (CRNs) compiled from previous publications. Arrows indicate the directionality of reactions observed experimentally, with colors indicating stronger (black) or weaker (gray) responses. Segmented connectors indicate non-cross-reactive targets. Each ellipse represents one peptide in the context of (A) murine H-2Kb, (B) human HLA-A*02:01, or (C) murine H-2Db MHC allotypes. Each ellipse contains the peptide sequence, abbreviation, and PDB code (when available). Ellipses’ colors indicate the source of the cross-reactivity information. Most data were compiled from Cornberg et al. (22) (orange and red ellipses) and expanded with data from Shen et al. (28) (cyan) and Fytili et al. (60) (yellow). Gray ellipses indicate data from Wlodarczyk et al. (17), and dark green ellipses indicate targets included based on sequential/structural analyses (see Methods and Resources). The symbol # was used to indicate reactions suggested by sequential/structural analyses that were not yet tested in vitro/in vivo. Purple areas indicate complexes with greater structural similarity according to our hierarchical clustering analyses.
Figure 2
Figure 2
Schematic representation of experimentally observed cross-reactivity patterns. Two alternative dendrograms were drawn to represent alternative outcomes observed in experiments previously performed by Cornberg et al. (22). (A) VV-A11198-specific T-cells recovered from mice previously immunized with lymphocytic choriomeningitis virus (LCMV) recognize the cognate peptide (indicated by the gray box) as well as three other peptides derived from LCMV and one derived from pichinde virus (PV). We can represent these connections as a “cross-reactivity-cluster” in our dendrogram, as indicated in red. Another peptide derived from vaccinia virus (VV-E7130), however, is not recognized. (B) VV-A11198-specific T-cells recovered from mice previously immunized with vaccinia virus (VV) recognize the cognate peptide (gray box) as well as the other VV-derived peptide (VV-E7130) and one LCMV-derived peptide (LCMV-GP34). However, in this experiment, no cross-reactivity was observed against peptides LCMV-GP118, LCMV-NP205, and PV-NP205 (indicated by the green bar). Although targeting the same VV-derived peptide, the alternative cross-reactivity patterns described in panels (A,B) reflect the use of different T-cell lines in each experiment (indicated as a blue or pink T-cell). Note that cross-reactivity between VV-A11198 and LCMV-GP34 was observed in both experiments, suggesting higher structural similarity of these peptides when displayed by H-2Kb. All peptides involved in these experiments are restricted to the murine MHC H-2Kb. This is a schematic representation, and the heights of the edges in the dendrogram do not capture the actual “distances” among the peptide-targets. Additional information on the presented peptides can be found in Table S1 in Supplementary Material.
Figure 3
Figure 3
Extended H-2Kb-restricted clustering. Structure-based hierarchical clustering performed with pvclust (61). Each putative cluster is represented by a specific edge (gray numbers), in order of increasing heights (y axis). Cluster confidence is measured with two p-values, approximately unbiased (AU), and bootstrap probabilities (BP). Lines highlighted in purple indicate structures with greater structural similarity (as represented in Figure 1). Lines highlighted in blue and pink indicate putative cross-reactivity thresholds for different memory T-cells (see Figure 2). Each peptide target is colored according to Figure 1. Peptide abbreviation and sequence are provided, with red amino acids indicating changes in relation to VV-A11198. *Crystal structure 3TID was used to represent LCMV-GP34, despite presenting a C8M exchange, as indicated by its sequence (see Methods and Resources).
Figure 4
Figure 4
Structural similarity between cross-reactive complexes. TCR-interacting surfaces of selected pMHC complexes were computed with Grasp2 (64). The rows correspond to different datasets of cross-reactive complexes. The central column indicates the reference (cognate) complex in each row (B,E,H). The left column indicates a known complex with limited cross-reactivity (A,D,G), while the right column indicates a highly cross-reactive complex (C,F,I). MHC heavy chain domains α1 and α2 are indicated in each complex, as well as the region corresponding to the peptide (black rectangle). Colors indicate the range of the electrostatic potential over the surface, from −5 kT/e (red) to +5 kT/e (blue). Complex information and peptide sequence are depicted below each pMHC. For crystal structures, the corresponding PDB ID is also provided. Complexes with no published crystal structure were modeled (see Methods and Resources). Peptide sequences in each line indicate mutations in relation to the corresponding reference peptide (central column). Green arrows highlight “spicy” features of peptides with “limited” cross-reactivity (left column). Black and gray arrows indicate the intensity and preferred directionality of cross-reactivities observed in vitro. The symbol # indicates a cross-reactivity that is suggested by our structural analyses, but that was not yet tested experimentally.
Figure 5
Figure 5
Structural features of different regions produce alternative clusters. Schematic representation of the structural relationships among three HLA-A*02:01-restricted complexes displaying the virus-derived peptides EBV-BMLF1300, EBV-BRLF1109, and HCV-NS31073_varG3-18. Peptide sequences indicate the differences in relation to EBV-BRLF1109. (A) Focusing the analysis on the region in contact primarily with the TCR’s Vα domain (as in Figure S1E in Supplementary Material), we observe greater structural similarity between EBV-BRLF1109 and HCV-NS31073_varG3-18, while EBV-BMLF1300 stands out as an unrelated complex. Cross-reactivity between EBV-BRLF1109 and HCV-NS31073_varG3-18 is suggested by our structural analyses but has not yet been tested experimentally. (B) Focusing the analysis on the region in contact primarily with the TCR’s Vβ domain (as in Figure S1F in Supplementary Material), the three complexes become much more similar, with slightly bigger topographical differences for HCV-NS31073_varG3-18. Cross-reactivity from EBV-BMLF1300 to EBV-BRLF1109 has been observed experimentally, in this preferred direction. Although both TCR domains are interacting with the pMHC surface at the same time, there is experimental evidence that one of the domains can be more critical than the other to recognize a given complex (24). The highlighted areas on the pMHC surfaces were arbitrarily defined, for illustration purposes, and do not correspond to the footprint of any particular TCR. In the same way, the heights of the edges in the dendrogram do not capture the actual “distances” among the complexes. The corresponding PDB code is provided for crystal structures; remaining complexes were modeled (see Methods and Resources). The colors over the surfaces indicate the range of charge distribution, from −5 kT/e (red) to +5 kT/e (blue). Additional information on the displayed peptides can be found in Table S1 in Supplementary Material.

Similar articles

Cited by

References

    1. Dzik JM. The ancestry and cumulative evolution of immune reactions. Acta Biochim Pol (2010) 57(4):443–66. - PubMed
    1. Hirano M. Evolution of vertebrate adaptive immunity: immune cells and tissues, and AID/APOBEC cytidine deaminases. Bioessays (2015) 37(8):877–87.10.1002/bies.201400178 - DOI - PubMed
    1. Welsh RM, Selin LK, Szomolanyi-Tsuda E. Immunological memory to viral infections. Annu Rev Immunol (2004) 22:711–43.10.1146/annurev.immunol.22.012703.104527 - DOI - PubMed
    1. Lauring AS, Frydman J, Andino R. The role of mutational robustness in RNA virus evolution. Nat Rev Microbiol (2013) 11(5):327–36.10.1038/nrmicro3003 - DOI - PMC - PubMed
    1. Vandiedonck C, Knight JC. The human Major Histocompatibility Complex as a paradigm in genomics research. Brief Funct Genomic Proteomic (2009) 8(5):379–94.10.1093/bfgp/elp010 - DOI - PMC - PubMed