

Identification of a key role of widespread epigenetic drift in Barrett's esophagus and esophageal adenocarcinoma
- PMID: 29046735
- PMCID: PMC5644061
- DOI: 10.1186/s13148-017-0409-4
Identification of a key role of widespread epigenetic drift in Barrett's esophagus and esophageal adenocarcinoma
Abstract
Background: Recent studies have identified age-related changes in DNA methylation patterns in normal and cancer tissues in a process that is called epigenetic drift. However, the evolving patterns, functional consequences, and dynamics of epigenetic drift during carcinogenesis remain largely unexplored. Here we analyze the evolution of epigenetic drift patterns during progression from normal squamous esophagus tissue to Barrett's esophagus (BE) to esophageal adenocarcinoma (EAC) using 173 tissue samples from 100 (nonfamilial) BE patients, along with publically available datasets including The Cancer Genome Atlas (TCGA).
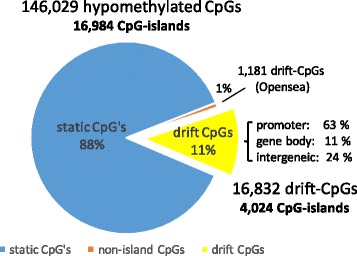
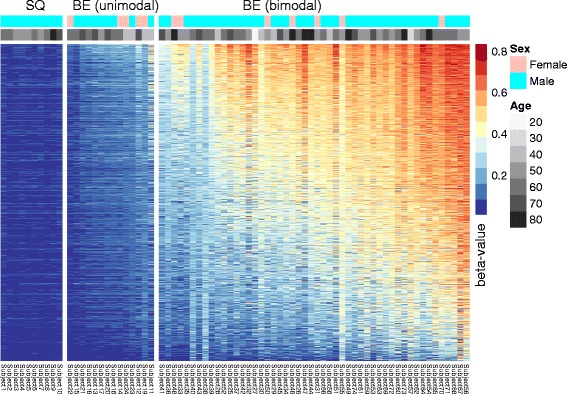
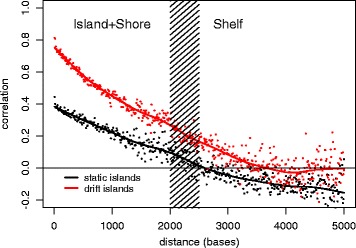
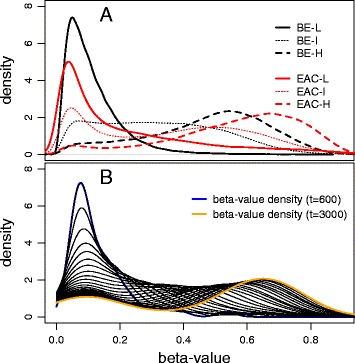
Results: Our analysis reveals extensive methylomic drift between normal squamous esophagus and BE tissues in nonprogressed BE patients, with differential drift affecting 4024 (24%) of 16,984 normally hypomethylated cytosine-guanine dinucleotides (CpGs) occurring in CpG islands. The majority (63%) of islands that include drift CpGs are associated with gene promoter regions. Island CpGs that drift have stronger pairwise correlations than static islands, reflecting collective drift consistent with processive DNA methylation maintenance. Individual BE tissues are extremely heterogeneous in their distribution of methylomic drift and encompass unimodal low-drift to bimodal high-drift patterns, reflective of differences in BE tissue age. Further analysis of longitudinally collected biopsy samples from 20 BE patients confirm the time-dependent evolution of these drift patterns. Drift patterns in EAC are similar to those in BE, but frequently exhibit enhanced bimodality and advanced mode drift. To better understand the observed drift patterns, we developed a multicellular stochastic model at the CpG island level. Importantly, we find that nonlinear feedback in the model between mean island methylation and CpG methylation rates is able to explain the widely heterogeneous collective drift patterns. Using matched gene expression and DNA methylation data in EAC from TCGA and other publically available data, we also find that advanced methylomic drift is correlated with significant transcriptional repression of ~ 200 genes in important regulatory and developmental pathways, including several checkpoint and tumor suppressor-like genes.
Conclusions: Taken together, our findings suggest that epigenetic drift evolution acts to significantly reduce the expression of developmental genes that may alter tissue characteristics and improve functional adaptation during BE to EAC progression.
Keywords: Barrett’s esophagus (BE); DNA methylation; Endogenous retroviruses (ERVs); Epigenetic drift; Esophageal adenocarcinoma (EAC); Neoplastic progression; Tissue age; Transcriptional repression in cancer.
Conflict of interest statement
Competing interests
The authors declare that they have no competing interest.
Publisher’s Note
Springer Nature remains neutral with regard to jurisdictional claims in published maps and institutional affiliations.
Figures
Similar articles
-
Global DNA methylation patterns in Barrett's esophagus, dysplastic Barrett's, and esophageal adenocarcinoma are associated with BMI, gender, and tobacco use.Clin Epigenetics. 2016 Oct 27;8:111. doi: 10.1186/s13148-016-0273-7. eCollection 2016. Clin Epigenetics. 2016. PMID: 27795744 Free PMC article.
-
Fields of aberrant CpG island hypermethylation in Barrett's esophagus and associated adenocarcinoma.Cancer Res. 2000 Sep 15;60(18):5021-6. Cancer Res. 2000. PMID: 11016622
-
Identification of Subtypes of Barrett's Esophagus and Esophageal Adenocarcinoma Based on DNA Methylation Profiles and Integration of Transcriptome and Genome Data.Gastroenterology. 2020 May;158(6):1682-1697.e1. doi: 10.1053/j.gastro.2020.01.044. Epub 2020 Feb 4. Gastroenterology. 2020. PMID: 32032585 Free PMC article.
-
Role of epigenetic alterations in the pathogenesis of Barrett's esophagus and esophageal adenocarcinoma.Int J Clin Exp Pathol. 2012;5(5):382-96. Epub 2012 May 23. Int J Clin Exp Pathol. 2012. PMID: 22808291 Free PMC article. Review.
-
Genetic and Epigenetic Alterations in Barrett's Esophagus and Esophageal Adenocarcinoma.Gastroenterol Clin North Am. 2015 Jun;44(2):473-89. doi: 10.1016/j.gtc.2015.02.015. Epub 2015 Apr 1. Gastroenterol Clin North Am. 2015. PMID: 26021206 Free PMC article. Review.
Cited by
-
Feasibility Study Utilizing NanoString's Digital Spatial Profiling (DSP) Technology for Characterizing the Immune Microenvironment in Barrett's Esophagus Formalin-Fixed Paraffin-Embedded Tissues.Cancers (Basel). 2023 Dec 18;15(24):5895. doi: 10.3390/cancers15245895. Cancers (Basel). 2023. PMID: 38136440 Free PMC article.
-
DNA methylome and transcriptome analysis established a model of four differentially methylated positions (DMPs) as a diagnostic marker in esophageal adenocarcinoma early detection.PeerJ. 2021 May 7;9:e11355. doi: 10.7717/peerj.11355. eCollection 2021. PeerJ. 2021. PMID: 34012728 Free PMC article.
-
An improved epigenetic counter to track mitotic age in normal and precancerous tissues.Nat Commun. 2024 May 17;15(1):4211. doi: 10.1038/s41467-024-48649-8. Nat Commun. 2024. PMID: 38760334 Free PMC article.
-
Epigenetics as a mediator of plasticity in cancer.Science. 2023 Feb 10;379(6632):eaaw3835. doi: 10.1126/science.aaw3835. Epub 2023 Feb 10. Science. 2023. PMID: 36758093 Free PMC article. Review.
-
Highly recurrent CBS epimutations in gastric cancer CpG island methylator phenotypes and inflammation.Genome Biol. 2021 Jun 1;22(1):167. doi: 10.1186/s13059-021-02375-2. Genome Biol. 2021. PMID: 34074348 Free PMC article.
References
-
- Ahuja N, Li Q, Mohan AL, Baylin SB, Issa JPJ. Aging and DNA methylation in colorectal mucose and cancer. Cancer Research. 1998;58(23):5489–5494. - PubMed
Publication types
MeSH terms
Supplementary concepts
Grants and funding
LinkOut - more resources
Full Text Sources
Other Literature Sources
Medical
Molecular Biology Databases
