

Post-Processing Partitions to Identify Domains of Modularity Optimization
- PMID: 29046743
- PMCID: PMC5642987
- DOI: 10.3390/a10030093
Post-Processing Partitions to Identify Domains of Modularity Optimization
Abstract
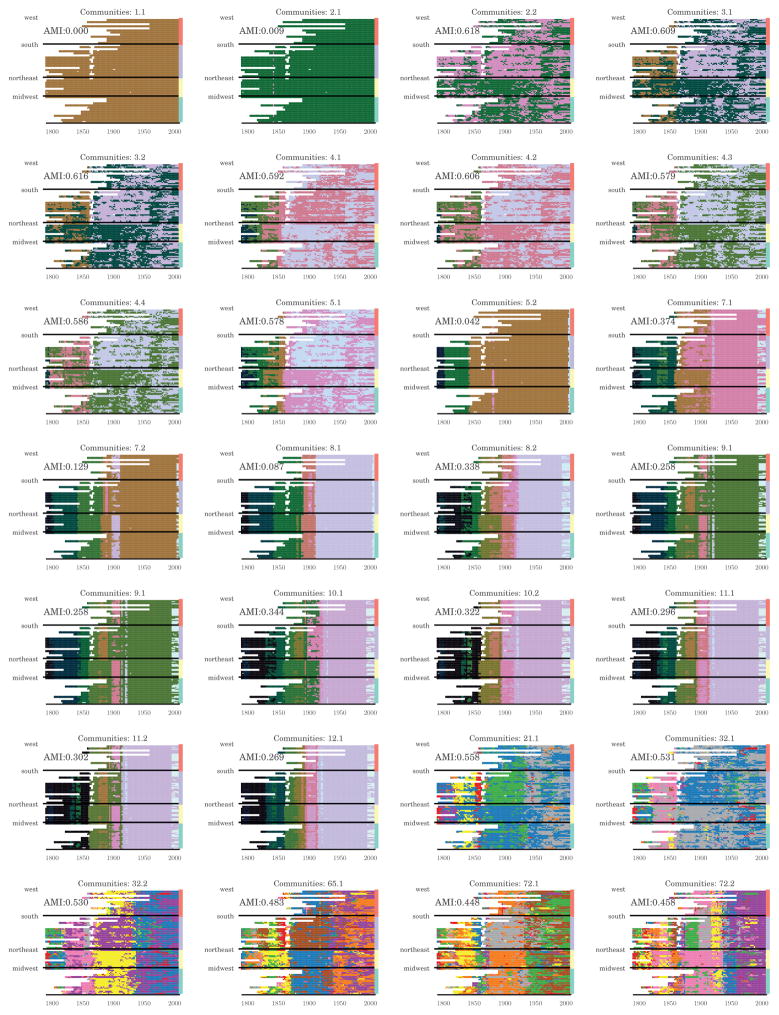
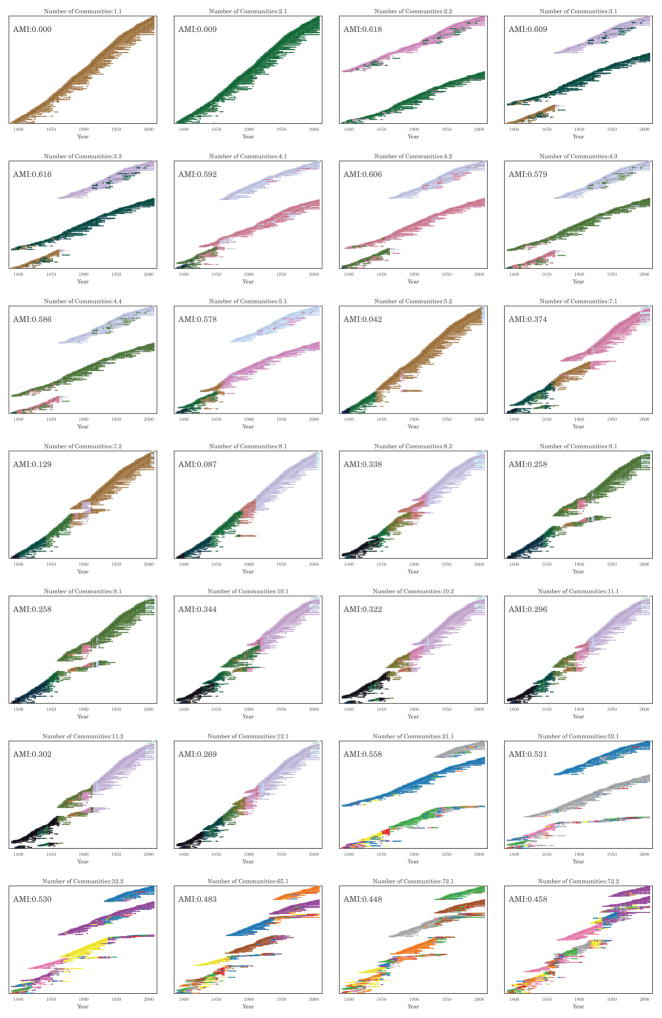
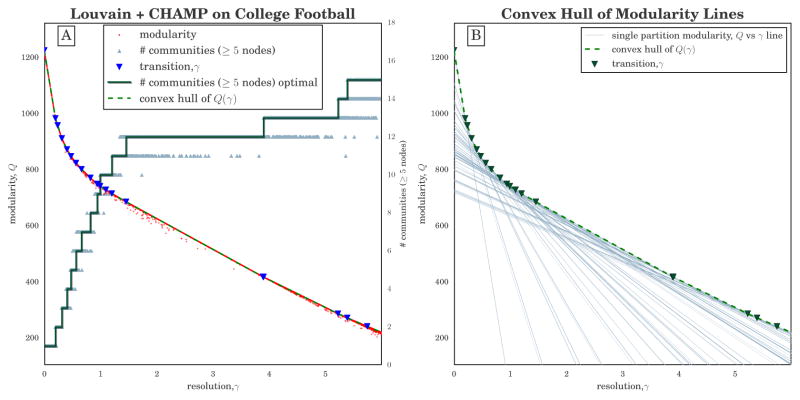
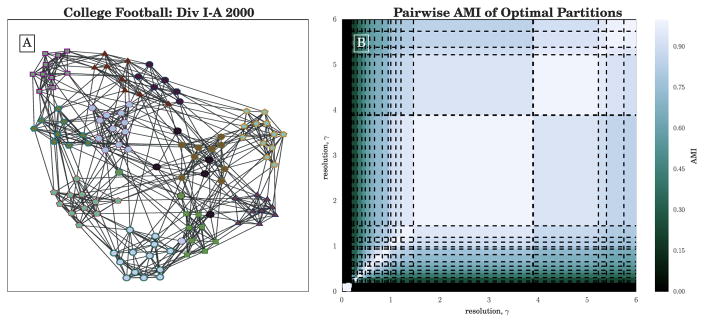
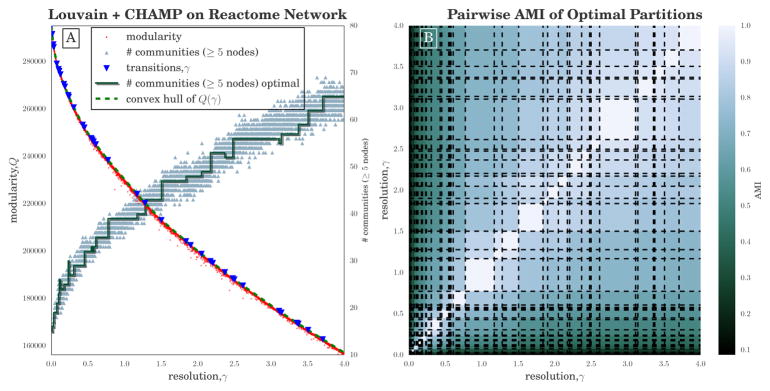
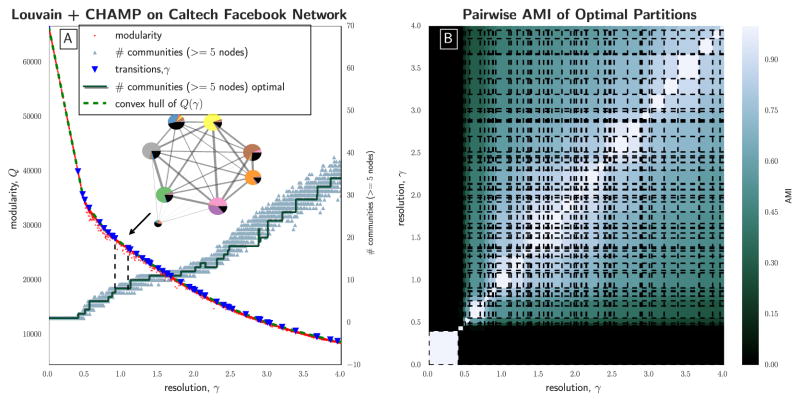
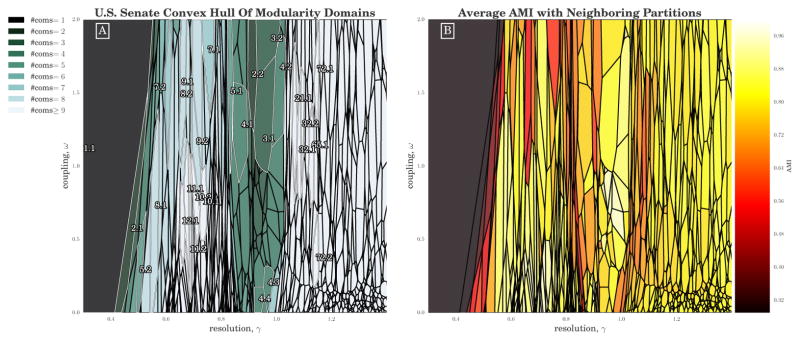
We introduce the Convex Hull of Admissible Modularity Partitions (CHAMP) algorithm to prune and prioritize different network community structures identified across multiple runs of possibly various computational heuristics. Given a set of partitions, CHAMP identifies the domain of modularity optimization for each partition-i.e., the parameter-space domain where it has the largest modularity relative to the input set-discarding partitions with empty domains to obtain the subset of partitions that are "admissible" candidate community structures that remain potentially optimal over indicated parameter domains. Importantly, CHAMP can be used for multi-dimensional parameter spaces, such as those for multilayer networks where one includes a resolution parameter and interlayer coupling. Using the results from CHAMP, a user can more appropriately select robust community structures by observing the sizes of domains of optimization and the pairwise comparisons between partitions in the admissible subset. We demonstrate the utility of CHAMP with several example networks. In these examples, CHAMP focuses attention onto pruned subsets of admissible partitions that are 20-to-1785 times smaller than the sets of unique partitions obtained by community detection heuristics that were input into CHAMP.
Keywords: community detection; modularity; multilayer networks; networks; resolution parameter.
Conflict of interest statement
Conflicts of Interest: The authors declare no conflict of interest.
Figures
Similar articles
-
Finite-state parameter space maps for pruning partitions in modularity-based community detection.Sci Rep. 2022 Sep 23;12(1):15928. doi: 10.1038/s41598-022-20142-6. Sci Rep. 2022. PMID: 36151268 Free PMC article.
-
Bayan algorithm: Detecting communities in networks through exact and approximate optimization of modularity.Phys Rev E. 2024 Oct;110(4-1):044315. doi: 10.1103/PhysRevE.110.044315. Phys Rev E. 2024. PMID: 39562863
-
Improved community detection in weighted bipartite networks.R Soc Open Sci. 2016 Jan 20;3(1):140536. doi: 10.1098/rsos.140536. eCollection 2016 Jan. R Soc Open Sci. 2016. PMID: 26909160 Free PMC article.
-
Robustness modularity in complex networks.Phys Rev E. 2022 May;105(5-1):054308. doi: 10.1103/PhysRevE.105.054308. Phys Rev E. 2022. PMID: 35706196
-
Multistep greedy algorithm identifies community structure in real-world and computer-generated networks.Phys Rev E Stat Nonlin Soft Matter Phys. 2008 Aug;78(2 Pt 2):026112. doi: 10.1103/PhysRevE.78.026112. Epub 2008 Aug 20. Phys Rev E Stat Nonlin Soft Matter Phys. 2008. PMID: 18850902
Cited by
-
Comparing Shared Patient Networks Across Payers.J Gen Intern Med. 2019 Oct;34(10):2014-2020. doi: 10.1007/s11606-019-04978-9. Epub 2019 Apr 3. J Gen Intern Med. 2019. PMID: 30945065 Free PMC article.
-
Multiresolution Consensus Clustering in Networks.Sci Rep. 2018 Feb 19;8(1):3259. doi: 10.1038/s41598-018-21352-7. Sci Rep. 2018. PMID: 29459635 Free PMC article.
-
The modulation of brain network integration and arousal during exploration.Neuroimage. 2021 Oct 15;240:118369. doi: 10.1016/j.neuroimage.2021.118369. Epub 2021 Jul 6. Neuroimage. 2021. PMID: 34242784 Free PMC article.
-
Finite-state parameter space maps for pruning partitions in modularity-based community detection.Sci Rep. 2022 Sep 23;12(1):15928. doi: 10.1038/s41598-022-20142-6. Sci Rep. 2022. PMID: 36151268 Free PMC article.
-
Metabolomic networks connect host-microbiome processes to human Clostridioides difficile infections.J Clin Invest. 2019 Aug 12;129(9):3792-3806. doi: 10.1172/JCI126905. eCollection 2019 Aug 12. J Clin Invest. 2019. PMID: 31403473 Free PMC article.
References
-
- Porter MA, Onnela JP, Mucha PJ. Communities in networks. Not AMS. 2009;56:1082–1097. 1164–1166.
-
- Fortunato S. Community detection in graphs. Phys Rep. 2010;486:75–174.
-
- Fortunato S, Hric D. Community detection in networks: A user guide. Phys Rep. 2016;659:1–44.
-
- Abbe E. Community detection and stochastic block models: Recent developments. 2017 arXiv. arXiv:1703.10146.
Grants and funding
LinkOut - more resources
Full Text Sources
Other Literature Sources