. 2017 Oct;40(10):737-751.
doi: 10.14348/molcells.2017.0069. Epub 2017 Oct 17.

GSK-J4-Mediated Transcriptomic Alterations in Differentiating Embryoid Bodies

Affiliations

GSK-J4-Mediated Transcriptomic Alterations in Differentiating Embryoid Bodies

Chanchal Mandal et al. Mol Cells. 2017 Oct.

Abstract

Histone-modifying enzymes are key players in the field of cellular differentiation. Here, we used GSK-J4 to profile important target genes that are responsible for neural differentiation. Embryoid bodies were treated with retinoic acid (10 μM) to induce neural differentiation in the presence or absence of GSK-J4. To profile GSKJ4-target genes, we performed RNA sequencing for both normal and demethylase-inhibited cells. A total of 47 and 58 genes were up- and down-regulated, respectively, after GSK-J4 exposure at a log2-fold-change cut-off value of 1.2 (p-value < 0.05). Functional annotations of all of the differentially expressed genes revealed that a significant number of genes were associated with the suppression of cellular proliferation, cell cycle progression and induction of cell death. We also identified an enrichment of potent motifs in selected genes that were differentially expressed. Additionally, we listed upstream transcriptional regulators of all of the differentially expressed genes. Our data indicate that GSK-J4 affects cellular biology by inhibiting cellular proliferation through cell cycle suppression and induction of cell death. These findings will expand the current understanding of the biology of histone-modifying enzymes, thereby promoting further investigations to elucidate the underlying mechanisms.

Keywords: RNA sequencing; cell cycle progression; gene expression; histone demethylase enzyme.


Figures

Fig. 1
Fig. 1. Functional annotation of differential gene expression
(A) Graphical experimental scheme for the differentiation/treatment protocol. NCCIT cells were stabilized and sub-cultured to form EBs. After stabilization, the EBs were treated with or without GSK-J4 for 48 h. The samples were subsequently collected for further analysis. (B) and (C) show heat maps of up- and down-regulated genes expressed between EB+RA (ER) and EB+RA+GSK-J4 (ERG), respectively. The gene expression level of each gene in the heat map is scaled and represented as relative expression changes. The color key shows relative expression within a range of 0 to 100. (D) and (E) show the bar graphs from the gene ontology analysis (Biological Process) of up- and down-regulated genes, respectively. The top 10 significant categories are plotted here. Related p-values are indicated in front of each bar. The total number of up- and downregulated genes is indicated in parentheses in the title of the bar graphs.
Fig. 2
Fig. 2. Inhibition of cell proliferation by GSK-J4 in differentiating EBs
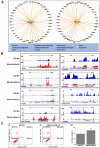
(A) Functional annotation of all DEGs with respect to cellular and molecular functions. The top 10 significant categories are plotted. Related p-values are indicated beside each block. Numbers indicated inside each block represent enriched gene numbers in each category. (B) The network for the “proliferation of cells” category adopted from IPA. The relationship is indicated as dotted lines. The blue-colored dotted lines represent the inhibition of cellular proliferation. Molecule legends are presented at the bottom of the network. The up- and down-regulated genes are indicated in orange and green, respectively. (C) Validation of related gene expression using the UCSC genome browser. We plotted the relative gene expression of randomly selected genes (BTG2, TXNIP, CDKN1C, GBX2, GPR3 and FZD4), where different colors represent different samples. d) Effect of 10 μM GSK-J4 treatment on the proliferating cell number. Proliferating cells were significantly reduced after GSK-J4 treatment. The values are represented as the average proliferating cells ± SEM bars, n = 3 replicates. Asterisks indicate statistically significant changes based on adjusted p-values < 0.05.
Fig. 3
Fig. 3. Suppression of cell cycle progression by GSK-J4 in differentiating EBs
(A) Network for the category “cell cycle progression” adopted from IPA. The relationship is indicated as dotted lines. The blue-colored dotted lines represent the inhibition of cell cycle progression. Molecule legends are presented at the bottom of the network. The up- and down-regulated genes are indicated in orange and green, respectively. (B)Validation of related gene expression using the UCSC genome browser. We plotted the relative gene expression of randomly selected genes (GADD45B, GADD45G, HMOX1, ID3, CCND1 and LIN28A), where different colors represent different samples. (C) Cell cycle analysis of control and demethylase-inhibited samples. i) and ii) show the results of the cell cycle analysis using flow cytometry in EB+RA and EB+RA+GSK-J4, respectively. The peaks in the illustration correspond to the G1, S and G2 phases of the cell cycle. iii) Bar graphs showing the percentages of cells in each phase of the cell cycle. The asterisks indicate statistically significant changes based on adjusted p-values < 0.05.
Fig. 4
Fig. 4. GSK-J4 treatment induces cell death through apoptosis and necrosis in differentiating EBs
(A) Network for the categories “apoptosis” and “necrosis” adopted from IPA. The relationship is indicated using dotted lines. The mastered colored dotted lines represent the activation of cellular death either through apoptosis or necrosis. Molecule legends are presented at the bottom of the networks. The up-and down-regulated genes are indicated in orange and green, respectively. (B) Validation of related gene expression using the UCSC genome browser. The relative gene expression of randomly selected genes (JUN, MSX2, ULK1, PPP1R15A, HOXA1, HOXB1, MiR17HG and VASH2) is plotted, where different colors represent different samples. c) Cellular apoptosis was measured using FACS and an Annexin V-FITC apoptosis kit. A two-parameter histogram dot plot displays FITC on the x-axis and PI on the y-axis. i) and ii) represent the percentage of cells that were positive for Annexin V-FITC and/or propidium iodide inside the quadrants (Q1 = necrotic cells, Q2 = late-stage apoptotic cells, Q3 = living cells, and Q4 = early-stage apoptotic cells). iii) shows the percentage of total cell death in the EB+RA and EB+RA+GSK-J4 samples. The asterisks indicate statistically significant changes based on adjusted p-values < 0.05.
Fig. 5
Fig. 5. Motif enrichment analysis
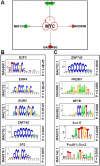
(A) Network showing up-streaming transcriptional regulators of CCND1, GADD45B, GADD45G and MIR17HG. (B) and (C) represent transcription factor binding motifs of all up- and down-regulated genes, respectively. We performed enrichment analysis using the known TF motifs in the JASPAR database. The top 5 motifs are plotted for up- and down-regulated genes as indicated.
Fig. 6
Fig. 6. Functional annotation of differential gene expression in RA-treated EBs
(A) The intersection between (EB vs EB+RA) and (EB+RA vs EB+RA+GSK-J4) showed that no genes were shared. (B) Bar graphs from the gene ontology analysis (Biological Process) of up- regulated genes. Five enriched categories are plotted with their p-values indicated in front of each bar. (C) Functional annotation of all DEGs with respect to cellular and molecular functions. The top 10 significant categories are plotted. Related p-values are indicated beside each block. Numbers indicated inside each block represent enriched gene numbers in each category.
Fig. 7
Fig. 7. qRT-PCR analysis to validate the RNA-seq results and neural marker expression
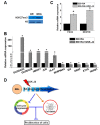
(A) Changes in H3K27me3 levels in response to GSK-J4 during EB differentiation. Whole cell extracts were collected from cells treated for 48 h, isolated using RIPA buffer, and immunoblotted with H3K27me3 and H3 antibodies. ER and ERG represents EB+RA and EB+RA+GSK-J4, respectively. (B) qRT-PCR results. We randomly selected 10 genes to observe their expression levels in GSK-J4-treated differentiating EBs. The expression value was normalized to the GAPDH expression level. Values are represented as the average mRNA expression ± SEM bars, n = 3 replicates. Asterisks indicate statistically significant changes based on adjusted p-values < 0.05. (C) qRT-PCR result showing the relative expression of neural marker genes in GSK-J4-treated differentiating EBs. (D) Schematic presentation of GSK-J4-mediated inhibition of cell proliferation through the suppression of cell cycle and activation of cell death.

Similar articles

Cited by

References

    1. Bolger A.M., Lohse M., Usadel B. Trimmomatic: a flexible trimmer for Illumina sequence data. Bioinformatics. 2014;30:2114–2120. - PMC - PubMed
    1. Burgold T., Spreafico F., De Santa F., Totaro M.G., Prosperini E., Natoli G., Testa G. The histone H3 lysine 27-specific demethylase Jmjd3 is required for neural commitment. PLoS One. 2008;3:e3034. - PMC - PubMed
    1. Chen C., Chang Y.C., Lan M.S., Breslin M. Leptin stimulates ovarian cancer cell growth and inhibits apoptosis by increasing cyclin D1 and Mcl-1 expression via the activation of the MEK/ERK1/2 and PI3K/Akt signaling pathways. Int J Oncol. 2013;42:1113–1119. - PubMed
    1. Chen Y., Jiang J., Zhao M., Luo X., Liang Z., Zhen Y., Fu Q., Deng X., Lin X., Li L., et al. microRNA-374a suppresses colon cancer progression by directly reducing CCND1 to inactivate the PI3K/AKT pathway. Oncotarget. 2016;7:41306–41319. - PMC - PubMed
    1. Cho H.J., Park S.M., Hwang E.M., Baek K.E., Kim I.K., Nam I.K., Im M.J., Park S.H., Bae S., Park J.Y., et al. Gadd45b mediates Fas-induced apoptosis by enhancing the interaction between p38 and retinoblastoma tumor suppressor. J Biol Chem. 2010;285:25500–25505. - PMC - PubMed

MeSH terms

LinkOut - more resources