

Wetland characteristics linked to broad-scale patterns in Culiseta melanura abundance and eastern equine encephalitis virus infection
- PMID: 29047412
- PMCID: PMC5648514
- DOI: 10.1186/s13071-017-2482-0
Wetland characteristics linked to broad-scale patterns in Culiseta melanura abundance and eastern equine encephalitis virus infection
Abstract
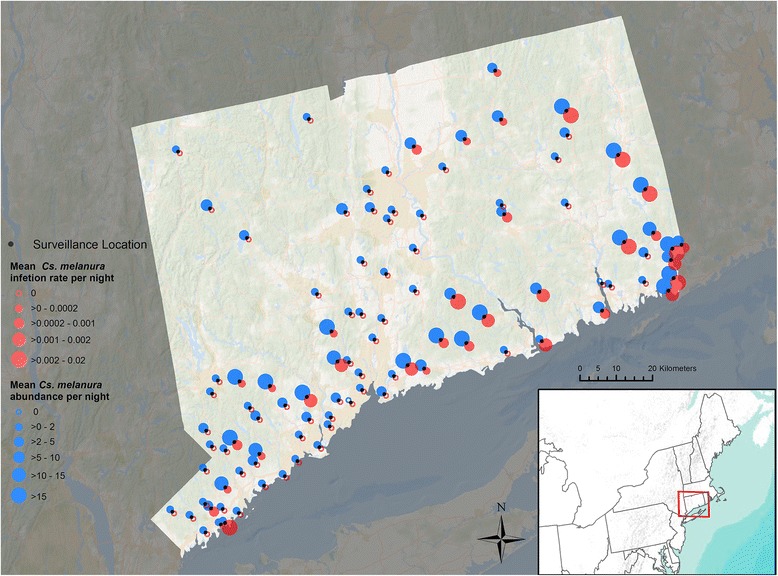
Background: Eastern equine encephalitis virus (EEEV) is an expanding mosquito-borne threat to humans and domestic animal populations in the northeastern United States. Outbreaks of EEEV are challenging to predict due to spatial and temporal uncertainty in the abundance and viral infection of Cs. melanura, the principal enzootic vector. EEEV activity may be closely linked to wetlands because they provide essential habitat for mosquito vectors and avian reservoir hosts. However, wetlands are not homogeneous and can vary by vegetation, connectivity, size, and inundation patterns. Wetlands may also have different effects on EEEV transmission depending on the assessed spatial scale. We investigated associations between wetland characteristics and Cs. melanura abundance and infection with EEEV at multiple spatial scales in Connecticut, USA.
Results: Our findings indicate that wetland vegetative characteristics have strong associations with Cs. melanura abundance. Deciduous and evergreen forested wetlands were associated with higher Cs. melanura abundance, likely because these wetlands provide suitable subterranean habitat for Cs. melanura development. In contrast, Cs. melanura abundance was negatively associated with emergent and scrub/shrub wetlands, and wetland connectivity to streams. These relationships were generally strongest at broad spatial scales. Additionally, the relationships between wetland characteristics and EEEV infection in Cs. melanura were generally weak. However, Cs. melanura abundance was strongly associated with EEEV infection, suggesting that wetland-associated changes in abundance may be indirectly linked to EEEV infection in Cs. melanura. Finally, we found that wet hydrological conditions during the transmission season and during the fall/winter preceding the transmission season were associated with higher Cs. melanura abundance and EEEV infection, indicating that wet conditions are favorable for EEEV transmission.
Conclusions: These results expand the broad-scale understanding of the effects of wetlands on EEEV transmission and help to reduce the spatial and temporal uncertainty associated with EEEV outbreaks.
Keywords: Connectivity; Culiseta melanura; Drought; Eastern equine encephalitis virus; Hydrology; Vegetation; Wetlands.
Conflict of interest statement
Ethics approval and consent to participate
Not applicable.
Consent for publication
Not applicable.
Competing interests
The authors declare that they have no competing interests.
Publisher’s Note
Springer Nature remains neutral with regard to jurisdictional claims in published maps and institutional affiliations.
Figures
Similar articles
-
Ecology and Epidemiology of Eastern Equine Encephalitis Virus in the Northeastern United States: An Historical Perspective.J Med Entomol. 2022 Jan 12;59(1):1-13. doi: 10.1093/jme/tjab077. J Med Entomol. 2022. PMID: 34734628 Free PMC article. Review.
-
Vector-Host Interactions of Culiseta melanura in a Focus of Eastern Equine Encephalitis Virus Activity in Southeastern Virginia.PLoS One. 2015 Sep 1;10(9):e0136743. doi: 10.1371/journal.pone.0136743. eCollection 2015. PLoS One. 2015. PMID: 26327226 Free PMC article.
-
Insights into the recent emergence and expansion of eastern equine encephalitis virus in a new focus in the Northern New England USA.Parasit Vectors. 2015 Oct 9;8:516. doi: 10.1186/s13071-015-1145-2. Parasit Vectors. 2015. PMID: 26453283 Free PMC article.
-
Dynamics of Vector-Host Interactions in Avian Communities in Four Eastern Equine Encephalitis Virus Foci in the Northeastern U.S.PLoS Negl Trop Dis. 2016 Jan 11;10(1):e0004347. doi: 10.1371/journal.pntd.0004347. eCollection 2016 Jan. PLoS Negl Trop Dis. 2016. PMID: 26751704 Free PMC article.
-
Ecology of Eastern Equine Encephalitis Virus in the Southeastern United States: Incriminating Vector and Host Species Responsible for Virus Amplification, Persistence, and Dispersal.J Med Entomol. 2022 Jan 12;59(1):41-48. doi: 10.1093/jme/tjab076. J Med Entomol. 2022. PMID: 34734635 Review.
Cited by
-
Wolbachia and mosquitoes: Exploring transmission modes and coevolutionary dynamics in Shandong Province, China.PLoS Negl Trop Dis. 2024 Sep 12;18(9):e0011944. doi: 10.1371/journal.pntd.0011944. eCollection 2024 Sep. PLoS Negl Trop Dis. 2024. PMID: 39264945 Free PMC article.
-
Ecology and Epidemiology of Eastern Equine Encephalitis Virus in the Northeastern United States: An Historical Perspective.J Med Entomol. 2022 Jan 12;59(1):1-13. doi: 10.1093/jme/tjab077. J Med Entomol. 2022. PMID: 34734628 Free PMC article. Review.
-
Four Human Cases of Eastern Equine Encephalitis in Connecticut, USA, during a Larger Regional Outbreak, 2019.Emerg Infect Dis. 2021 Aug;27(8):2042-51. doi: 10.3201/eid2708.203730. Emerg Infect Dis. 2021. PMID: 34289334 Free PMC article. Review.
-
Epidemic Alphaviruses: Ecology, Emergence and Outbreaks.Microorganisms. 2020 Aug 1;8(8):1167. doi: 10.3390/microorganisms8081167. Microorganisms. 2020. PMID: 32752150 Free PMC article. Review.
-
Eastern equine encephalitis in puppies in Michigan and New York states.J Vet Diagn Invest. 2018 Jul;30(4):633-636. doi: 10.1177/1040638718774616. Epub 2018 May 2. J Vet Diagn Invest. 2018. PMID: 29717641 Free PMC article.
References
MeSH terms
LinkOut - more resources
Full Text Sources
Other Literature Sources
Medical
