. 2017 Oct 19;8(10):e3130.
doi: 10.1038/cddis.2017.492.

p53 dynamics orchestrates with binding affinity to target genes for cell fate decision

Affiliations

p53 dynamics orchestrates with binding affinity to target genes for cell fate decision

Mengqiu Wu et al. Cell Death Dis. .

Abstract

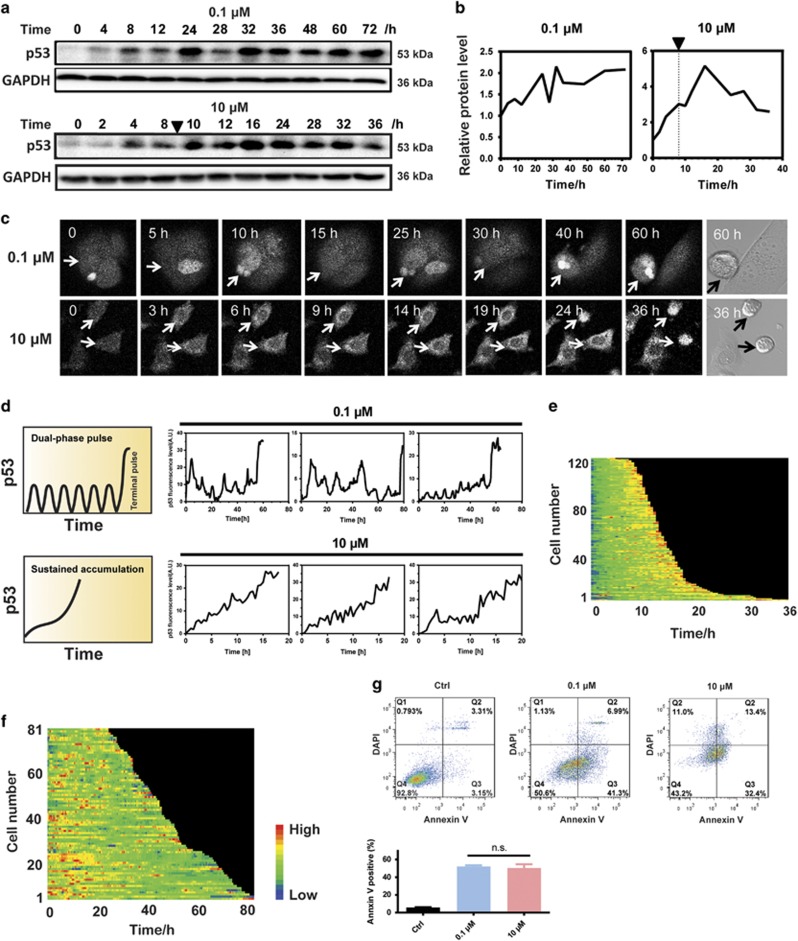
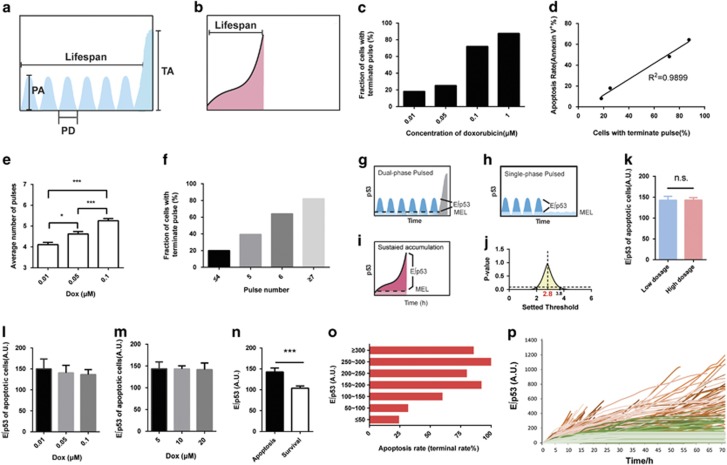
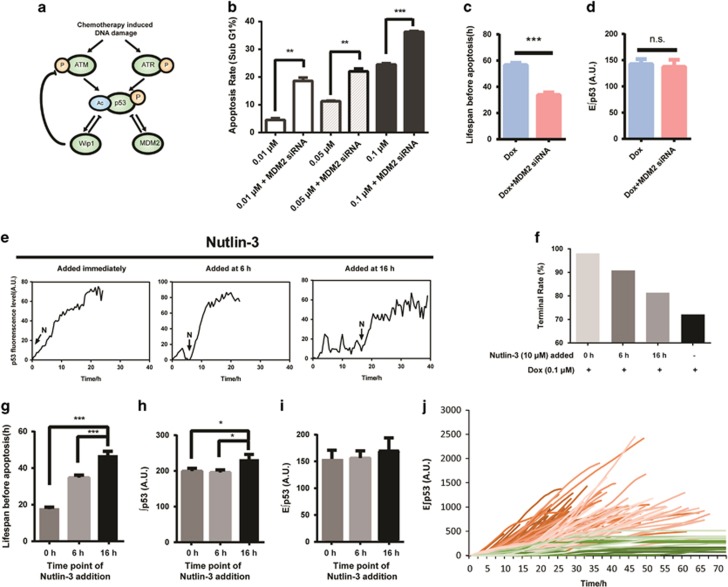
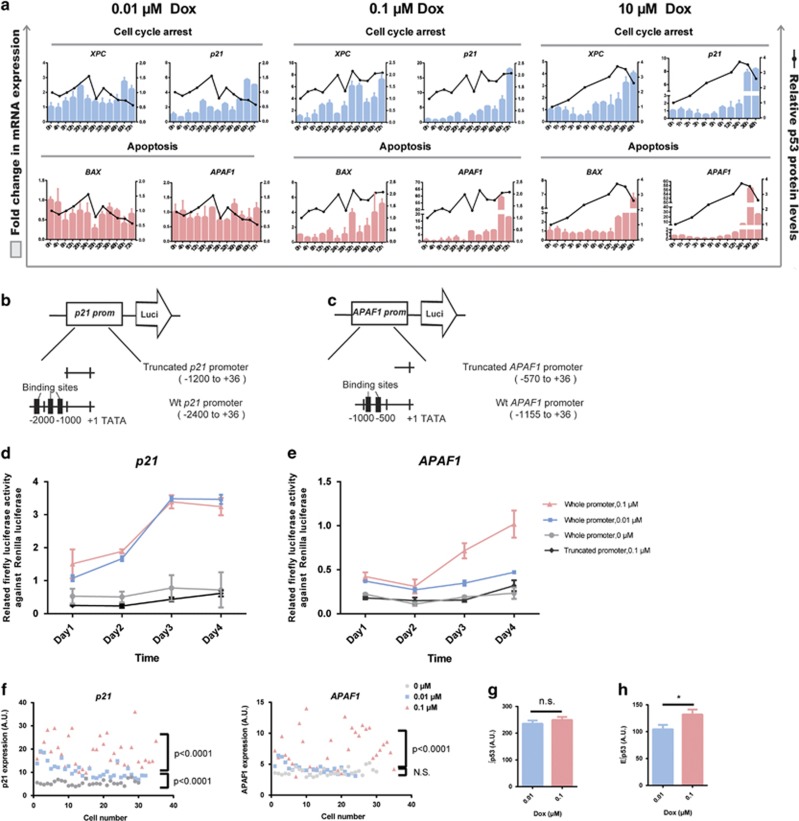
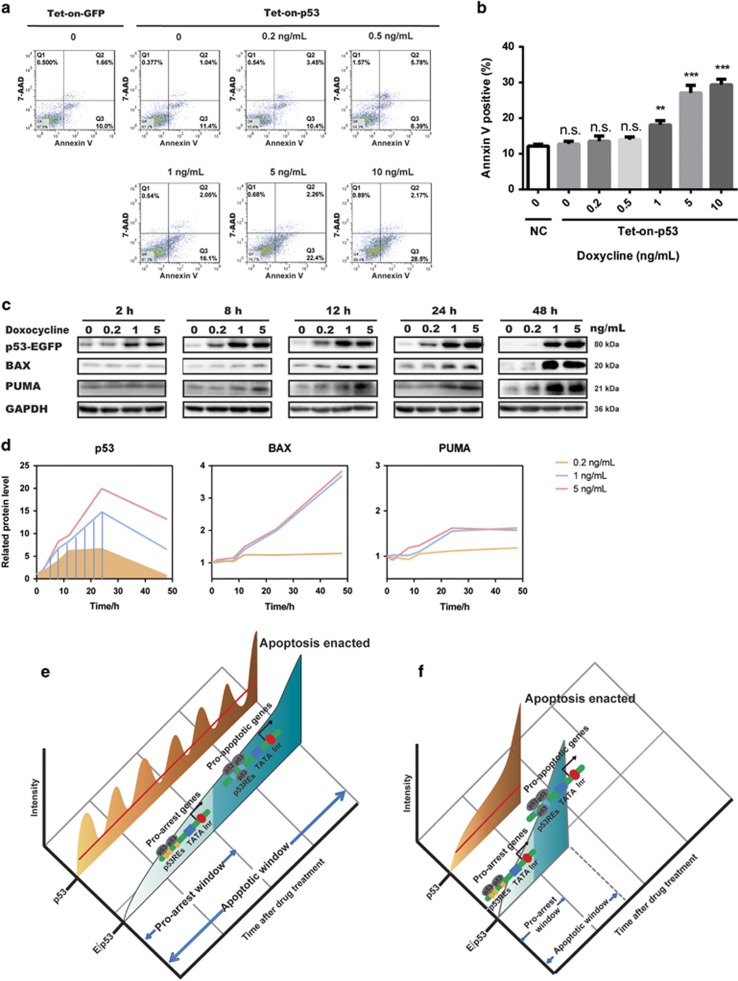
Emerging evidence support that temporal dynamics is pivotal for signaling molecules in orchestrating smart responses to diverse stimuli. p53 is such a signaling molecule that employs temporal dynamics for the selective activation of downstream target genes and ultimately for cell fate decision. Yet how this fine-tuned p53 machinery is quantitatively decoded remains largely unclear. Here we report a quantitative mechanism defining how p53 dynamics orchestrates with binding affinity to target genes for cell fate decision. Treating cells with a genotoxic drug doxorubicin at various doses and durations, we found that a mild and prolonged challenge triggered sequential p53 pulses and ultimately resulted in a terminal pulse enacting apoptosis in a comparable rate with that induced by an acute and high-dose treatment. To transactivate proapoptotic genes and thereafter executing apoptosis, p53 must exceed a certain threshold and accumulate for sufficient time at levels above it. Effective cumulative levels above the threshold, defined as E∫p53, but not the total accumulation levels of p53, precisely discriminate survival and apoptotic cells. p53 accumulation below this threshold, even with prolonging time to reach a total level comparable to that from the accumulation over the threshold, could not transactivate proapoptotic genes to which the binding affinity of p53 is lower than that of proarrest genes, and this property is independent of dynamic features. Our findings indicate that the dynamic feature per se does not directly control cell fate, but rather it orchestrates with the binding affinity to target genes to confer an appropriate time window for cell fate choice. Our study provides a quantitative mechanism unifying p53 dynamics and binding affinity to target genes, providing novel insights to understand how p53 can respond quantitatively to chemotherapeutic drugs, and guiding the design of metronomic regimens for chemotherapeutic drugs.


Conflict of interest statement

The authors declare no conflict of interest.

Figures

Figure 1
Figure 1
Prolonged pulsatile and sustained activation lead to comparable cell apoptosis. (a) Immunoblots of p53 dynamics induced by a weak and prolonged stimulus (0.1 μM Dox treatment for 72 h) and a strong and acute stimulus (10 μM Dox treatment for 8 h). Triangle indicates the time when Dox was withdrawn. (b) Quantification of p53 abundance. Triangle and dashed line indicate the time when Dox was withdrawn. (c) Time-lapse images of representative MCF7 cells (indicated by arrows) expressing p53-Venus following Dox treatment. Cell apoptosis was identified visually by bright-field channel, and the corresponding p53-Venus levels were quantified from the fluorescence intensity. (d) Representative single-cell traces of MCF7-p53-Venus cells following Dox treatment. Corresponding p53 dynamic patterns are summarized on the left. (e and f) p53-Venus fluorescence for each cell cells under 10 μM (e) or 0.1 μM (f) Dox treatment were measured by time-lapse microscopy, floor-subtracted and drew into heat maps. p53 traces of individual cells are arranged from top to bottom by the lifespan. (g) Weak and prolonged stimulus (0.1 μM Dox treatment for 72 h), and a strong and acute stimulus (10 μM Dox treatment for 8 h and cultured to 48 h) lead to comparable apoptotic rate as shown by the flow cytometry analysis using Annexin V/DAPI staining. Control cells were cultured in drug-free medium for 4 days. NS, not significant
Figure 2
Figure 2
Integral cumulative levels of p53 over a threshold control cell fates. (a) Prolonged low-dose treatment of Dox (0.1 μM) initiated a series of pulses and then abruptly increased to a high-amplitude level of p53 (defined as ‘terminal pulse’). Metrics used to describe the dynamic pattern are pulse amplitude (PA), lifespan, pulse duration (PD), and terminal amplitude (TA). (b) Acute Dox treatment (10 μM) induced a sustained accumulation of p53. (c) The fraction of cells showing terminal pulses within 96 h under Dox treatments as specified. Number of cells (n)=121 (0.01 μM), n=127 (0.05 μM), n=118 (0.1 μM) and n=54 (1 μM). (d) Correlation analysis of apoptosis rate (Annexin V-positive rate) and the fraction of cells showing terminal pulse within 96 h (n=420 in total for single-cell analysis). (e) The average number of pulses in response to different dose of Dox stimuli. Number of cells (n)=121 (0.01 μM), n=127 (0.05 μM), and n=118 (0.1 μM). Data are represented as mean±S.E.M.; *P<0.05; ***P<0.001. (f) The fraction of cells showing terminal pulse after corresponding number of p53 pulses. The cell fraction in each bin was calculated by summarizing the number of cells showing corresponding number of pulses followed by dividing them by the total number of cells included in panel (e) (n=366). (gj) Schematic illustration of a predicted threshold in initiating apoptosis. The presumed threshold is defined as MEL and the p53 accumulation above MEL as effective cumulative level of p53 (E∫p53) (gi). The threshold was searched at a step of 0.1 A.U. from 0 to 5 A.U., and the value that delivered identical E∫p53 with the maximum P-value was designated as the threshold (j). (k) Average levels of E∫p53 from apoptotic cells treated with low (0.01–0.1 μM for 72 h, n=139) or high dose (5–20 μM for 8 h and cultured to 48 h, n=214) of Dox (threshold=2.8 A.U.). Data are represented as mean±S.E.M. (l and m) Average levels of E∫p53 from apoptotic cells treated with low (n=139) and high concentration (n=214) of Dox are shown, respectively. (n) E∫p53 level in apoptotic (n=227) and survival cells (n=139) within 96 h. Error bars represent S.E.M.; ***P<0.001. (o) Apoptotic rate (%) of cells that display corresponding levels of E∫p53. (p) Single-cell traces of E∫p53 in surviving cells (green) and apoptotic cells (red). Single-cell data for panels (o) and (p) were calculated using cells treated with 0.01, 0.1 and 10 μM Dox (n=367 in total). Cell fate can be identified visually by morphological changes observed using the bright-field channel. NS, not significant
Figure 3
Figure 3
MDM2 repression facilitates cell apoptosis without the change of E∫p53. (a) Regulatory network of p53 in response to chemotherapy. (b) Apoptotic rate of cells treated with Dox with or without MDM2 silencing for 72 h. Data are represented as mean±S.E.M.; **P<0.01; ***P<0.001. (c and d) Lifespan and E∫p53 level of cells treated with 0.1 μM Dox combined with or without MDM2 silencing. Data are represented as mean±S.E.M.; ***P<0.001. (e) Representative single-cell traces of MCF7-p53-Venus cells treated with 0.1 μM Dox combined with Nutlin-3 (10 μM) added immediately or at 6 and 16 h, following Dox treatment, respectively. ‘N’ with an arrow in the figure indicates the time when Nutlin-3 (N) was added. (f) The rate of cells exhibiting terminal pulse (terminal rate) under different treatments within 96 h (n=293 in total). (gi) Lifespan, ∫p53 and E∫p53 levels of apoptotic cells treated with 0.1 μM Dox and co-administered with Nutlin-3 added to medium at the indicated time points (n=175 in total). Error bars represent S.E.M.; *P<0.05; ***P<0.001. (j) Single cell traces of E∫p53 in response to 0.1 μM Dox treatment co-administered with Nutlin-3. Green, surviving cells (n=17); red, apoptotic cells (n=175). NS, not significant
Figure 4
Figure 4
E∫p53 differentiates the transactivation of different sets of target genes. (a) Expression of p53 target genes. mRNA levels of target genes under the indicated conditions are shown in histograms. Genes are grouped into cell cycle arrest- and apoptosis-related genes. Data of transcripts are mean±S.D. Relative p53 protein levels normalized to GAPDH are shown as black lines. (b) Luciferase reporter gene assay, using wild-type p21 promoter (−2400 to +36 bases, pGL3-p21-Luci) and a truncated p21 promoter (−1200 to +36 bases) with deletion of three reported p53-binding sites. (c) Luciferase reporter gene assay, using wild-type APAF1 promoter (−1155 to +36 bases, pGL3-APAF1-Luci) and a truncated APAF promoter (−570 to +36 bases) with deletion of two reported p53-binding sites. (d and e) Relative luciferase activity in MCF7 cells transfected with p21 (d) and APAF1 (e) promoter reporters. Dual luciferase reporter assay was performed by transfecting p21 or APAF1 luciferase reporter construct together with pRL-SV40 vector as an internal standard. Truncated luciferase reporter construct was transfected as negative control. Cells were treated with 0.01 and 0.1 μM Dox for 1–4 days. Data are presented as mean±S.E.M. from three independent experiments. (f) FISH analysis of APAF1 and p21 transcripts after 0.01 and 0.1 μM Dox treatment for 72 h. n=30 (0 μM), n=31 (0.01 μM), and n=35 (0.1 μM). Unpaired Student’s t-test was conducted to determine the significance. (g and h) Average cumulative level of p53 (∫p53) (g) and effective cumulative level of p53 (E∫p53) (h) levels in cells treated with 0.01 μM (n=121) and 0.1 μM (n=118) Dox within 96 h. Data are represented as mean±S.E.M.; *P<0.05; NS, not significant
Figure 5
Figure 5
Doxycycline-inducible p53 expression system confirmed the established threshold of cell fate decision. (a and b) Flow cytometric analysis of apoptosis by Annexin V/7-AAD staining using tet-on-strict-p53-transfected MCF7 cells induced with 0–10 ng/ml doxycycline for 4 days. Tet-on-strict-GFP-transfected MCF7 cells were used as a control. Quantitation of the percentages of Annexin V-positive cells is shown in panel (b). Data are presented as mean±S.D. from three independent experiments. Unpaired Student’s t-test was conducted to determine the significance; *P<0.05, **P<0.01. (c and d) Western blotting analysis of p53 and apoptosis-associated proteins in MCF7 cells transfected with tet-on-strict-p53 plasmid and induced with 0.2–5 ng/ml doxycycline for the indicated duration. Quantification of p53, BAX, and PUMA protein abundance is shown in panel (d). Shaded areas indicate the cumulative level of p53 at corresponding time points. (e and f) Model illustrating how E∫p53 controls cell fate. Prolonged low-dose treatment of Dox initiated a series of pulses followed by a terminal pulse with increased amplitude (e). Acute and high-dose Dox treatment induced a sustained accumulation of p53 (f). E∫p53, the cumulative level of p53 above a MEL, discriminates the activation of different sets of target genes and thereby differentiates cell fate choice. NS, not significant

Similar articles

Cited by

References

    1. Perkins TJ, Swain PS. Strategies for cellular decision-making. Mol Syst Biol 2009; 5: 326. - PMC - PubMed
    1. Sims RJ, Reinberg D. Is there a code embedded in proteins that is based on post-translational modifications? Nat Rev Mol Cell Biol 2008; 9: 815–820. - PubMed
    1. Kruse JP, Gu W. Modes of p53 regulation. Cell 2009; 137: 609–622. - PMC - PubMed
    1. Pawson T, Nash P. Protein-protein interactions define specificity in signal transduction. Genes Dev 2000; 14: 1027–1047. - PubMed
    1. Hao N, O'Shea EK. Signal-dependent dynamics of transcription factor translocation controls gene expression. Nat Struct Mol Biol 2011; 19: 31–39. - PMC - PubMed

Publication types

MeSH terms