. 2017 Nov 1;6(11):1-6.
doi: 10.1093/gigascience/gix090.

Indexcov: fast coverage quality control for whole-genome sequencing

Affiliations

Indexcov: fast coverage quality control for whole-genome sequencing

Brent S Pedersen et al. Gigascience. .

Abstract

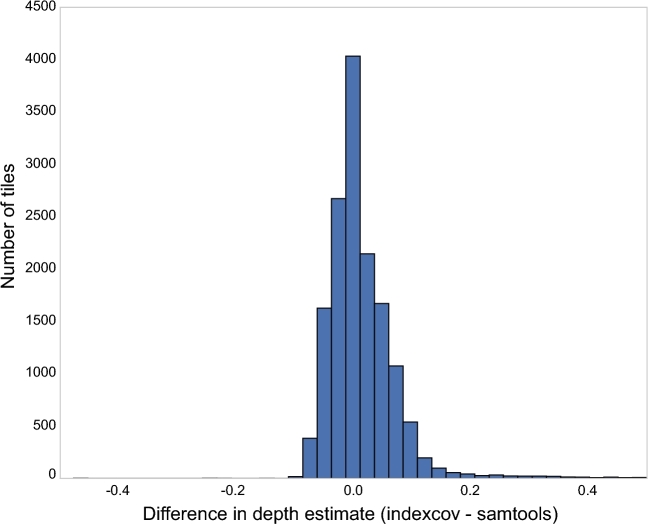
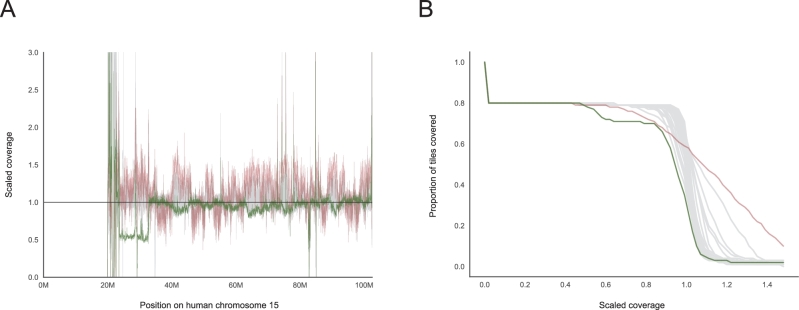
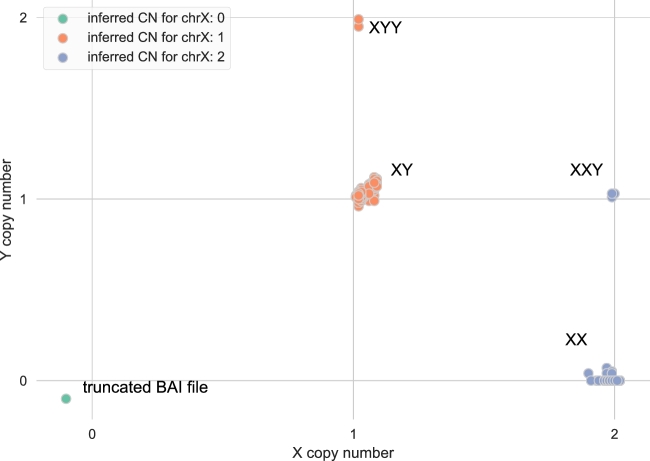
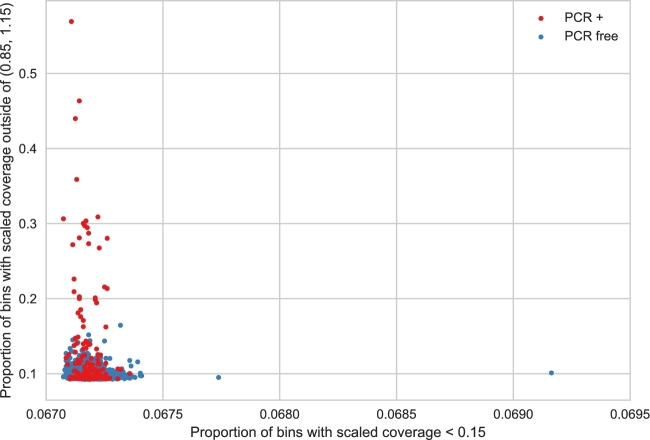
The BAM and CRAM formats provide a supplementary linear index that facilitates rapid access to sequence alignments in arbitrary genomic regions. Comparing consecutive entries in a BAM or CRAM index allows one to infer the number of alignment records per genomic region for use as an effective proxy of sequence depth in each genomic region. Based on these properties, we have developed indexcov, an efficient estimator of whole-genome sequencing coverage to rapidly identify samples with aberrant coverage profiles, reveal large-scale chromosomal anomalies, recognize potential batch effects, and infer the sex of a sample. Indexcov is available at https://github.com/brentp/goleft under the MIT license.


Figures

Figure 1:
Figure 1:
Difference between median-scaled sequencing depth in 16 384-bp bins from samtools, which recovers per-base depth from the BAM file, and indexcov, which estimates coverage from the BAM index. Samtools required ∼61 minutes to compute the depth in 16.4-kb bins of the genome, whereas indexcov estimated the depth of these regions in about 2 seconds. Pictured here is a summary from NA12878 chromosome 1. The x-axis values indicate the relative difference in normalized coverage estimates between samtools and indexcov in 16.4-kb bins for chromosome 1. Of the 15 196 bins measured, only 2.76% (420) have a difference in depth estimate outside the range of the plot (greater than 0.5). The Pearson correlation coefficient between the samtools and indexcov depths is 0.81.
Figure 2:
Figure 2:
Coverage profiles for 45 human WGS samples on chromosome 15. The estimated coverage along the chromosome is shown in (A), and an alternative representation showing the proportion of tiles covered at a certain depth and as the lower path is shown in (B). The sample highlighted with a green line has a ∼10-MB deletion just after the (acrocentric) centromere that has been previously associated with Angelman syndrome. The crimson line tracks a sample with a large variability in coverage; samples like this one will have many spurious CNV calls. These plots are interactive in the indexcov output, allowing users to hover and identify samples of interest.
Figure 3:
Figure 3:
Sex inference plot for a cohort of 2076 human WGS samples analyzed with indexcov. Samples projected on this plot represent ∼30–40× human WGS from 519 “quartet” families recently analyzed as a study of simplex autism [13]. The x-axis shows the copy number for chrX, and the y-axis shows the copy number for chrY inferred by indexcov. Sex is inferred from the copy number of X. As expected, we see 2 dominant clusters of samples, 1 of males (X = 1 and Y = 1) and 1 of females (X = 2 and Y = 0). Notably, indexcov further identifies samples with supernumerary sex chromosome aneuploidies (XXY and XYY), which had previously been identified by SNP microarray analysis [15]. The green point in the lower left just below the origin represents a sample with no apparent coverage on chromosomes X or Y due to a truncated BAM index file, which can be rapidly corrected once identified by indexcov QC.
Figure 4:
Figure 4:
Proportion of 16 384-bp bins where the estimated coverage is less than 0.15 on the x-axis and outside of (0.85–1.15) on the y-axis among 2076 human WGS samples. High values on the x-axis indicate large areas with low or no coverage. Values on the y-axis indicate samples with a large bias—with high variance in coverage values. Note that the samples that were PCR-amplified (red) as part of the sample-preparation are generally more likely to have a higher proportion of bins outside of the expected (0.85–1.15) range.

References

    1. Li H, Handsaker B, Wysoker A et al. . The Sequence Alignment/Map format and SAMtools. Bioinformatics 2009;25:2078–9. - PMC - PubMed
    1. Samtools https://samtools.github.io/hts-specs/CRAMv3.pdf. Accessed 27 May 2017.
    1. Meynert AM, Bicknell LS, Hurles ME et al. . Quantifying single nucleotide variant detection sensitivity in exome sequencing. BMC Bioinformatics 2013;14:195. - PMC - PubMed
    1. Layer RM, Chiang C, Quinlan AR et al. . LUMPY: a probabilistic framework for structural variant discovery. Genome Biol 2014;15:R84. - PMC - PubMed
    1. Alkan C, Coe BP, Eichler EE. Genome structural variation discovery and genotyping. Nat Rev Genet 2011;12:363–76. - PMC - PubMed

Publication types