. 2018 Jan 1;27(1):41-52.
doi: 10.1093/hmg/ddx382.

Modeling neuro-immune interactions during Zika virus infection

Affiliations

Modeling neuro-immune interactions during Zika virus infection

Pinar Mesci et al. Hum Mol Genet. .

Abstract

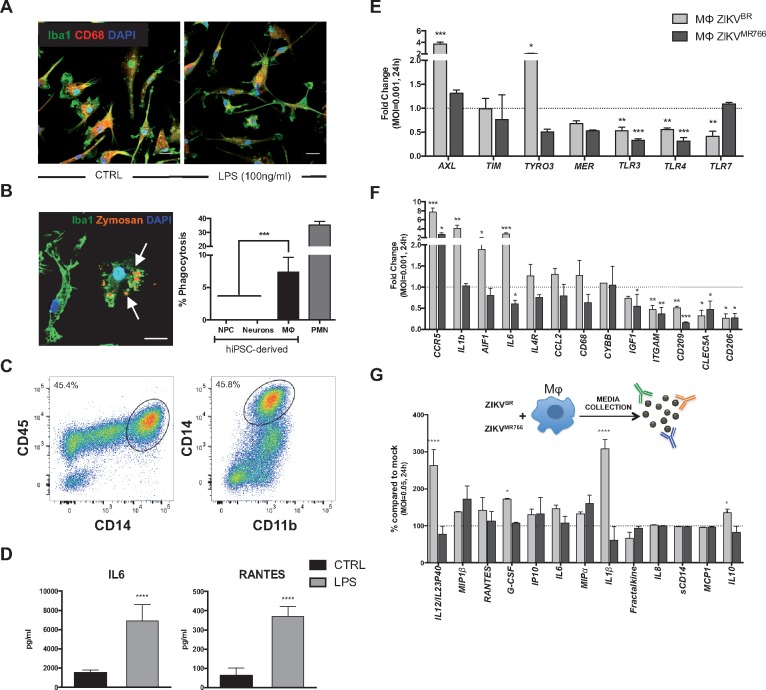
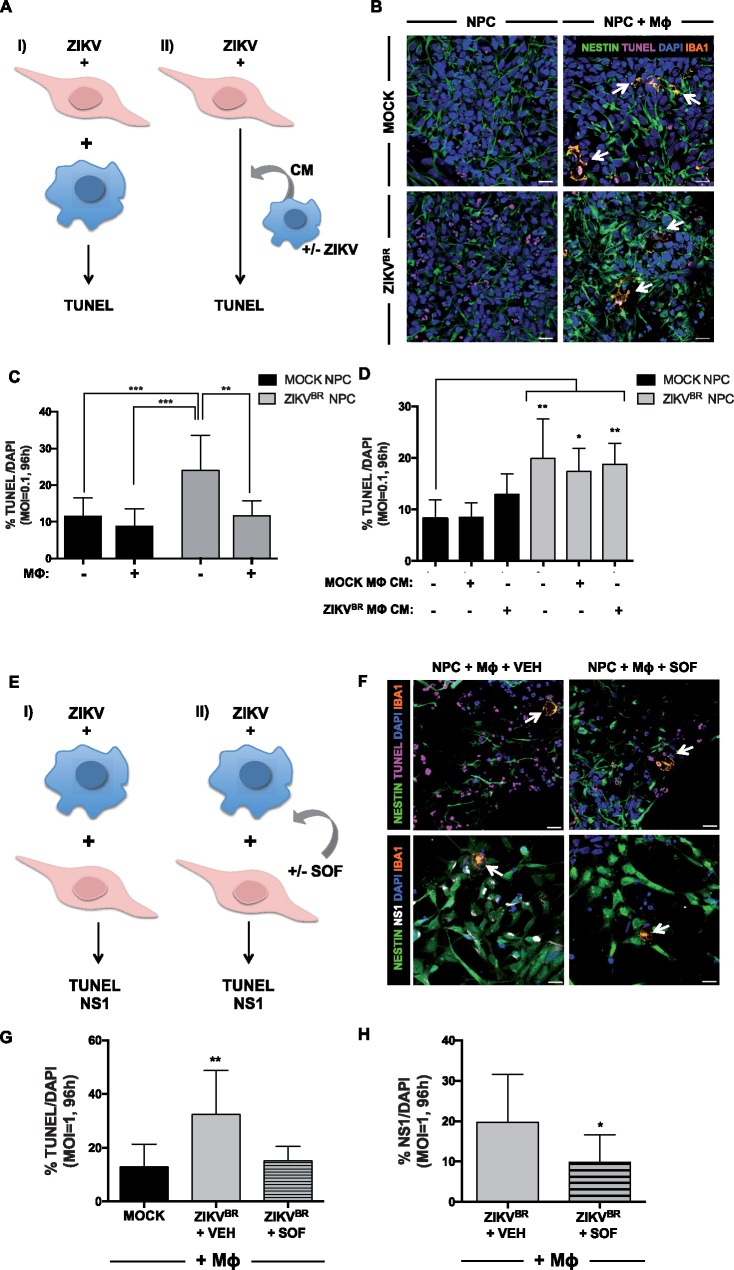
Although Zika virus (ZIKV) infection is often asymptomatic, in some cases, it can lead to birth defects in newborns or serious neurologic complications in adults. However, little is known about the interplay between immune and neural cells that could contribute to the ZIKV pathology. To understand the mechanisms at play during infection and the antiviral immune response, we focused on neural precursor cells (NPCs)-microglia interactions. Our data indicate that human microglia infected with the current circulating Brazilian ZIKV induces a similar pro-inflammatory response found in ZIKV-infected human tissues. Importantly, using our model, we show that microglia interact with ZIKV-infected NPCs and further spread the virus. Finally, we show that Sofosbuvir, an FDA-approved drug for Hepatitis C, blocked viral infection in NPCs and therefore the transmission of the virus from microglia to NPCs. Thus, our model provides a new tool for studying neuro-immune interactions and a platform to test new therapeutic drugs.


Figures

Figure 1.
Figure 1.
Characterization of functional human induced pluripotent stem cell (hiPSC)- derived macrophages/microglia (MΦ) and their Innate immune system receptors and inflammatory response upon Zika virus (ZIKV) infection. (A) Representative images of hiPSC-derived MΦ stained with anti-Iba1 (green), anti-CD68 (red) and fluorescent nuclear DAPI stain (blue): control MΦ untreated CTRL, (left) and treated with lipopolysaccharides (LPS, 100 ng/ml, right). Scale bar: 20 μm. (B) pHrodo red zymosan (orange) particles engulfed by hiPSC-derived MΦ, stained with anti-Iba1 (green). Scale bar: 50 μm. Phagocytosis percentage determined by group B streptococcus (GBS) internalization. Note that hiPSC-derived neural precursors (NPC) or neurons do not engulf any GBS. Human primary polymorphonuclear neutrophils (PMN) were used as an experimental positive control. One-way ANOVA with Tukey multiple comparison tests were performed, bars represent means of the percentage of phagocytosis ± SD ***P < 0.001. (C) Fluorescent activated cell-sorting (FACS) analysis of monocytic lineage cells derived sequentially from pluripotent stem cells. (D) Cytometric Bead Array (CBA) performed on conditioned media from control or 1 μg/ml LPS-treated MΦ for 24–30 h. Student’s t-tests were performed to compare the two groups. Bars represent means of the amount of cytokines/chemokines released in the media (pg/ml) ± SD, ****P < 0.0001 compared with control (CTRL) untreated cells. (E) The expression of potential Zika virus entry receptors including AXL, TIM, TYRO3, MER and several TLR receptors (TLR3, TLR4, TLR7) was measured by qRT-PCR in MΦ infected with either Brazilian (ZIKVBR) or the highly in vitro passaged MR766 ZIKV strain (ZIKVMR766) (MOI=0.001). RNA was analysed 24 h p.i. One-way ANOVA with Tukey multiple comparison tests were performed. The bars represent means of the mRNA fold change compared with the mock-infected MΦ, shown by a dashed line on the y-axis at 1 ± SD, *P < 0.05, **P < 0.01, ***P < 0.001. (F) Inflammatory response was measured by qRT-PCR in hiPSC- MΦ infected with either the ZIKVBR or ZIKVMR766 (MOI=0.001). RNA was extracted 24 h after infection. One-way ANOVA with Tukey multiple comparison tests were performed, bars represent means of the mRNA fold change compared with the mock-infected MΦ, shown by a dashed line on the y-axis at 1 ± SD, *P < 0.05, **P < 0.01, ***P < 0.001, MΦ ZIKVBR is represented in light grey and ZIKVMR766 in dark grey. (G) Inflammatory cytokines/chemokines were measured in the media conditioned by MΦ for 24–30 h p.i (MOI=0.05) with ZIKVBR or ZIKV MR766. One-way ANOVA with Sidak multiple comparisons tests were performed. Bars represent average of fold change (in %) compared with the mock-infected MΦ (as shown by the dashed line at 100%) ± SD, *P < 0.05, ****P < 0.0001, MΦ ZIKVBR is represented in light grey and ZIKVMR766 in dark grey.
Figure 2.
Figure 2.
The impact of ZIKV on macrophage/microglia (MΦ) and NPCs co-culture. (A) Schematic of the experimental design. ZIKV-infected NPCs are co-cultured with either naïve MΦ (I), or mock or ZIKVBR-infected MΦ-conditioned media (MΦ CM) (II), followed by an analysis of cell death measured by the percentage of TUNEL positive cells. (B) Images of mock and ZIKVBR-infected NPCs stained with Nestin (green), TUNEL (pink) and fluorescent nuclear staining, DAPI (blue), and MΦ stained with Iba1 (orange) in control (upper left), ZIKVBR-infected NPCs (bottom left), in control NPCs co-cultured MΦ (upper right) and in ZIKVBR-infected NPCs co-cultured with MΦ (bottom right). White arrows point to MΦ (orange). Scale bar: 20 μm. (C) TUNEL images of NPCs infected with the ZIKVBR (MOI =0.1) were acquired, and the percentages of dying cells were calculated, averaged, and graphed accordingly. One-way ANOVA tests with Tukey multiple comparison were performed to compare different groups. The presented values are means of TUNEL+/DAPI+ percentage ± SD, **P < 0.01, ***P < 0.001. Note that infected NPCs have increased TUNEL+/DAPI+ percentage compared with the mock and the addition of MΦ decreases TUNEL+/DAPI+ percentage. (D) TUNEL images of NPCs infected with the ZIKVBR and treated with mock or ZIKVBR-infected MΦ conditioned media (MΦ CM) (MOI=0.1) were acquired, and the percentages of apoptotic cells were calculated, averaged, and graphed accordingly. One-way ANOVA with Tukey multiple comparisons tests were performed to compare different groups. The presented values are means of TUNEL+/DAPI+ percentage ± SD, *P < 0.05, **P < 0.01. (E) Schematic of the experimental design: ZIKV-infected MΦ are co-cultured with NPCs (I), treated with either vehicle (VEH) or Sofosbuvir (SOF) (II) for 96 h before quantification of TUNEL and NS1 positive cells. (F) Images of ZIKVBR-infected cells stained with Nestin (green), TUNEL (pink), Iba1 (orange) and DAPI (blue) (upper), and images of ZIKVBR-infected cells stained with Nestin (green), NS1 (white) and Iba1 (orange) (lower). MΦ were treated with either VEH (left), or 20μM SOF (right) after ZIKV-infection and co-cultured with NPCs. White arrows point to MΦ (orange). Scale bar: 20 μm. (G) TUNEL images of cells infected with the ZIKVBR (MOI =1) were acquired, and the percentages of dying cells were calculated, averaged, and graphed accordingly. One-way ANOVA tests with Tukey multiple comparison were performed to compare different groups. The presented values are means of TUNEL+/DAPI+ percentage ± SD, **P < 0.01. Note that MΦ treated with SOF and co-cultured infected NPCs have decreased TUNEL+/DAPI+ percentage compared with the vehicle (VEH). (H) NS1 images were acquired, and the percentages of NS1 positive cells were calculated, averaged, and graphed accordingly. One-way ANOVA with Tukey multiple comparisons tests were performed to compare different groups. The presented values are means of NS1+/DAPI+ percentage ± SD, *P < 0.05.

References

    1. Dick G.W.A., kitchen S.F., haddow A.J. (1952) Zika virus. I. Isolations and serological specificity. Trans. R. Soc. Trop. Med. Hyg., 46, 509–520. - PubMed
    1. Lanciotti R.S., Kosoy O.L., Laven J.J., Velez J.O., Lambert A.J., Johnson A.J., Stanfield S.M., Duffy M.R. (2008) Genetic and serologic properties of Zika virus associated with an epidemic, Yap State, Micronesia, 2007. Emerg. Infect. Dis., 14, 1232–1239. - PMC - PubMed
    1. Campos G.S., Bandeira A.C., Sardi S.I. (2015) Zika virus outbreak, Bahia, Brazil. Emerg. Infect. Dis., 21, 1885–1886. - PMC - PubMed
    1. Mlakar J., Korva M., Tul N., Popović M., Poljšak-Prijatelj M., Mraz J., Kolenc M., Resman Rus K., Vesnaver Vipotnik T., Fabjan Vodušek V.. et al. (2016) Zika virus associated with microcephaly. N. Engl. J. Med., 374, 951–958. - PubMed
    1. Beckham J.D., Pastula D.M., Massey A., Tyler K.L. (2016) Zika virus as an emerging global pathogen: neurological complications of Zika virus. JAMA Neurol., 10.1001/jamaneurol.2016.0800. - PMC - PubMed

Publication types