. 2017 Oct 13;68(17):4969-4981.
doi: 10.1093/jxb/erx300.

Linear discriminant analysis reveals differences in root architecture in wheat seedlings related to nitrogen uptake efficiency

Affiliations

Linear discriminant analysis reveals differences in root architecture in wheat seedlings related to nitrogen uptake efficiency

Kim Kenobi et al. J Exp Bot. .

Abstract

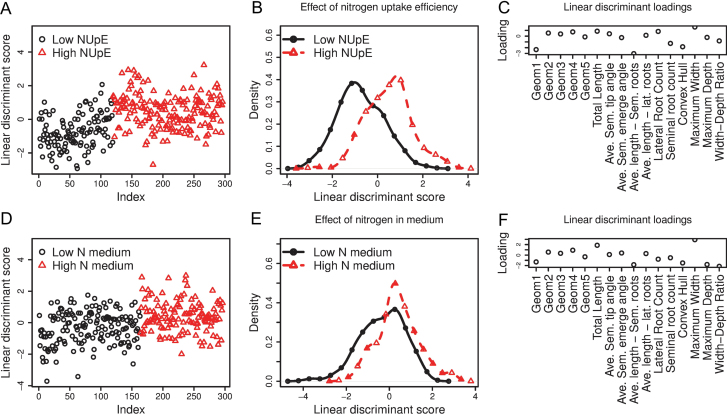
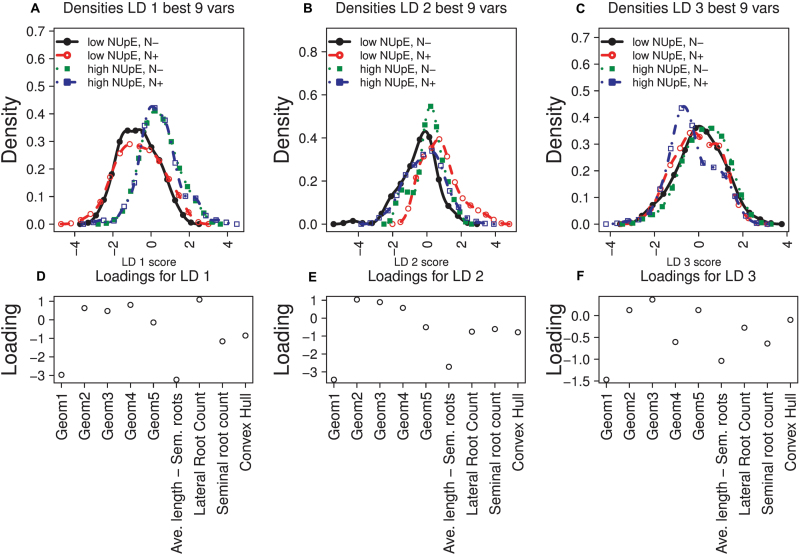
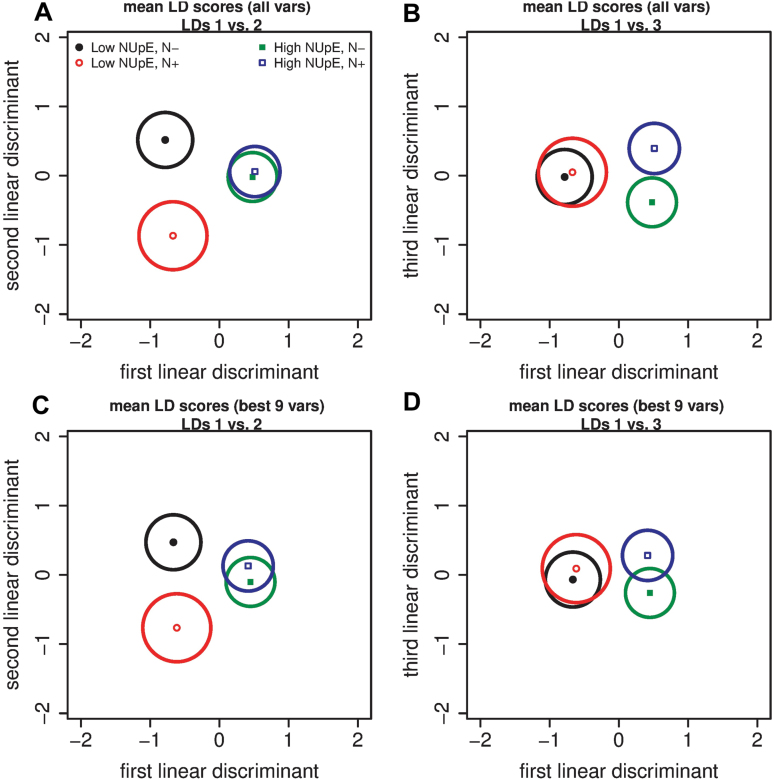
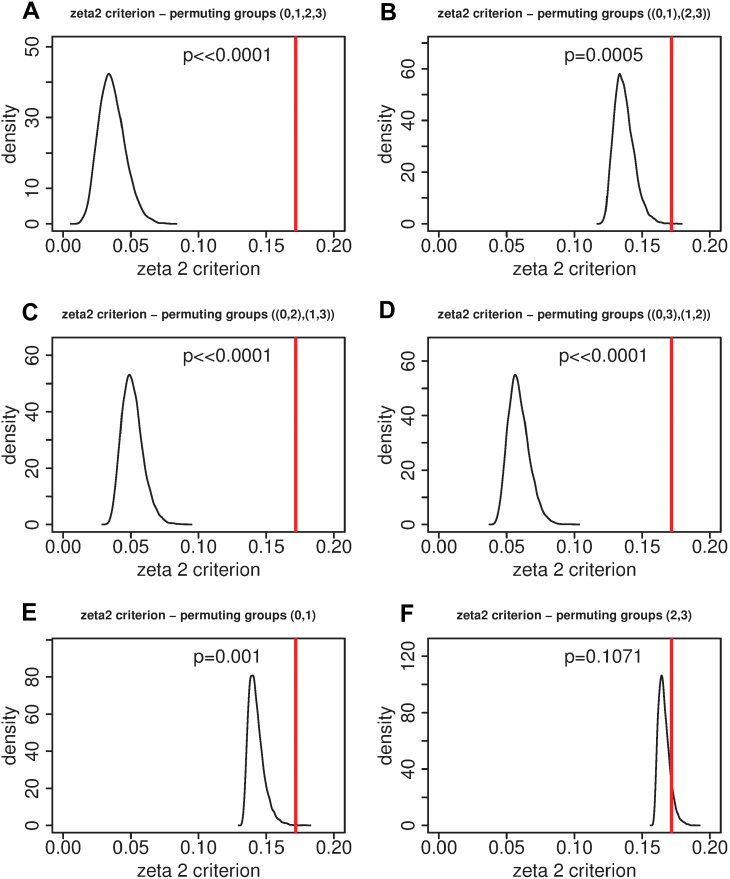
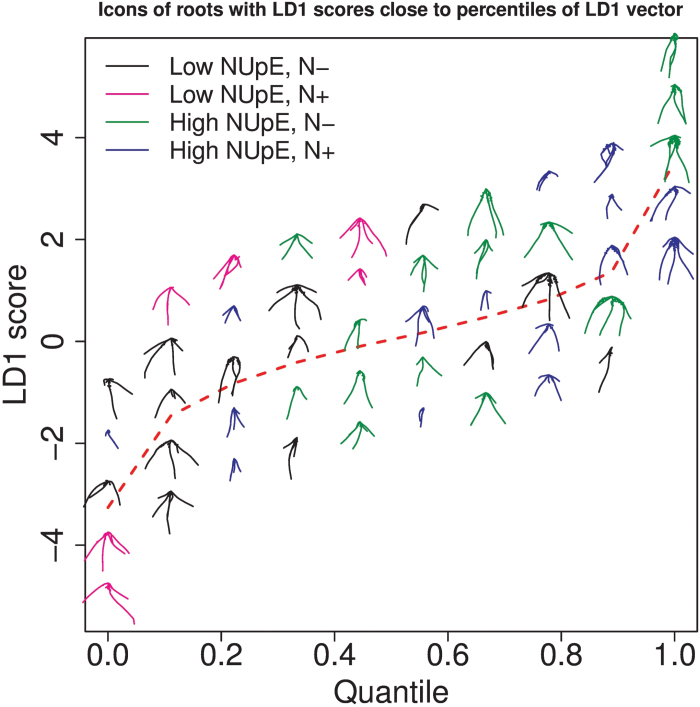
Root architecture impacts water and nutrient uptake efficiency. Identifying exactly which root architectural properties influence these agronomic traits can prove challenging. In this paper, approximately 300 wheat (Triticum aestivum) plants were divided into four groups using two binary classifications, high versus low nitrogen uptake efficiency (NUpE), and high versus low nitrate in the growth medium. The root system architecture for each wheat plant was captured using 16 quantitative variables. The multivariate analysis tool, linear discriminant analysis, was used to construct composite variables, each a linear combination of the original variables, such that the score of the plants on the new variables showed the maximum between-group variability. The results show that the distribution of root-system architecture traits differs between low- and high-NUpE plants and, less strongly, between low-NUpE plants grown on low versus high nitrate media.

Keywords: Linear discriminant analysis; Mahalanobis distance; Triticum aestivum; Watkins lines; nitrogen uptake efficiency; plant phenotyping; root system architecture; wheat root biology.


Figures

Fig. 1.
Fig. 1.
Seedling root phenotyping pipeline. (A) Growth assembly. (B) Image acquisition. (C) Example root image. (D) Root system extraction and quantification using RootNav software. (E) Reconstruction of root system in silico and trait quantification. Figure adapted from Atkinson et al. (2015).
Fig. 2.
Fig. 2.
Overview of the root system architecture of the Watkins lines used in this analysis. Row 1: low-NUpE lines, low nitrate; Row 2: low-NUpE lines, high nitrate; Row 3: high-NUpE lines, low nitrate; Row 4: high-NUpE lines, high nitrate. In each plot, all of the root systems of plants in that combination of line and nitrate treatment are overlaid. Moving from Row 1 to Row 2 or from Row 3 to Row 4, the same lines under the different treatment conditions are in the same column. Data are not available for line W199 grown in a high-nitrate medium.
Fig. 3.
Fig. 3.
The pairwise correlations of all of the root variables for which the correlation with at least one other variable is of magnitude at least 0.5. The lower-left panels show the numerical values of the correlations (rounded to two decimal places). The upper-right panels show the scatter plots. All variables are scaled to have a mean of zero and a variance of 1. Abbreviations: G1, Geom1; TL, total length; ALSR, average length – seminal roots; ALLR, average length – lateral roots; LRC, lateral root count; CH, convex hull; MW, maximum width; MD, maximum depth; WDR, width–depth ratio.
Fig. 4.
Fig. 4.
The Mahalanobis distances between samples corresponding to different lines and treatments. In (A) the columns or rows for the same line under low (N–) and high (N+) nitrate growth conditions are next to each other. In (B) the lines are grouped by nitrate treatment. The darker the square the smaller the distances between groups. Different patterns can be seen depending on how the lines are grouped.
Fig. 5.
Fig. 5.
The use of linear discriminant analysis to separate wheat lines by nitrogen uptake efficiency (A–C) and by nitrate treatment (D–F). (A) The linear discriminant scores for low and high nitrogen uptake efficiency (NUpE) wheat lines. (B) Density plots of the linear discriminant scores in (A). (C) The loadings associated with each variable in the linear discriminant analysis comparing low- and high-NUpE lines. (D) The linear discriminant scores for low- and high-nitrate media. (E) Density plots of the linear discriminant scores in (D). (F) The loadings associated with each variable in the linear discriminant analysis comparing low- and high-nitrate media.
Fig. 6.
Fig. 6.
The densities and variable loadings for linear discriminant analysis using the best nine variables as determined by the ς2 (zeta2) coefficient from the subselect package in R. (A–C) Density plots of scores on linear discriminants (LD) 1–3 under the four NUpE/nitrate treatment conditions shown in Table 1. (D–F) Loadings vectors for LD1–3.
Fig. 7.
Fig. 7.
The mean linear discriminant scores with 99% confidence regions for the LDA with all variables (A, B) and with the subset of the best nine variables identified using the subselect package in R (C, D). (A) LD1 versus LD2 for all variables; (B) LD1 versus LD3 for all variables; (C) LD1 versus LD2 for the nine best variables; and (D) LD1 versus LD3 for the nine best variables
Fig. 8.
Fig. 8.
The ς2 (zeta2) criterion in permutation tests with N=10 000 permutations of the grouping variable. The vertical line indicates the result obtained with the true groupings. Group elements within brackets are permuted, so for example [(0,1),(2,3)] means that group labels are permuted within the subgroup (0,1) and within the subgroup (2,3). The meanings of the codes are: 0, low NUpE, low-nitrate medium; 1, low NUpE, high-nitrate medium; 2, high NUpE, low-nitrate medium; 3, high NUpE, high-nitrate medium. (A) Permuting group labels across all four groups. (B) Permuting group labels within low (0,1) and high (2,3) NUpE. (C) Permuting group labels within low-N (0,2) and high-N (1,3) media. (D) Permuting group labels within groups (0,3) and (1,2). (E) Permuting group labels within low NUpE, leaving high-NUpE group labels constant. (F) Permuting group labels within high NUpE, leaving low-NUpE group labels constant. The P-values show the probability of observing a zeta2 criterion as large as obtained with true group labels if the distribution obtained under permutation was the true distribution. (This figure is available in colour at JXB online.)
Fig. 9.
Fig. 9.
A visualization of the first linear discriminant (LD) on the nine best variables. Roots are plotted for which their LD1 score is close to the percentiles (0,0.1,0.2,…,1) of the LD1 vector. The dashed red line shows the percentiles of the LD1 vector. The vertical separation of the roots at a particular x-value is only for clarity of presentation.

References

    1. Atkinson JA, Rasmussen A, Traini R, Voss U, Sturrock CJ, Mooney SJ, Wells DM, Bennett MJ. 2014. Branching out in roots: uncovering form, function and regulation. Plant Physiology 166, 538–550. - PMC - PubMed
    1. Atkinson JA, Wingen LU, Griffiths M et al. . 2015. Phenotyping pipeline reveals major seedling root growth QTL in hexaploid wheat. Journal of Experimental Botany 66, 2283–2292. - PMC - PubMed
    1. Bai C, Liang Y, Hawkesford MJ. 2013. Identification of QTLs associated with seedling root traits and their correlation with plant height in wheat. Journal of Experimental Botany 64, 1745–1753. - PMC - PubMed
    1. Bullitt E, Liu A, Aylward SR, Coffey C, Stone J, Mukherji SK, Muller KE, Pizer SM. 1999. Registration of 3D cerebral vessels with 2D digital angiograms: clinical evaluation. Academic Radiology 6, 539–546. - PubMed
    1. Canè MA, Maccaferri M, Nazemi G, Salvi S, Francia R, Colalongo C, Tuberosa R. 2014. Association mapping for root architectural traits in durum wheat seedlings as related to agronomic performance. Molecular Breeding 34, 1629–1645. - PMC - PubMed

Publication types

MeSH terms