. 2017 Nov;51(5):1482-1496.
doi: 10.3892/ijo.2017.4128. Epub 2017 Sep 19.

Evidence of lateral transmission of aggressive features between different types of breast cancer cells

Affiliations

Evidence of lateral transmission of aggressive features between different types of breast cancer cells

Nancy Adriana Espinoza-Sánchez et al. Int J Oncol. 2017 Nov.

Abstract

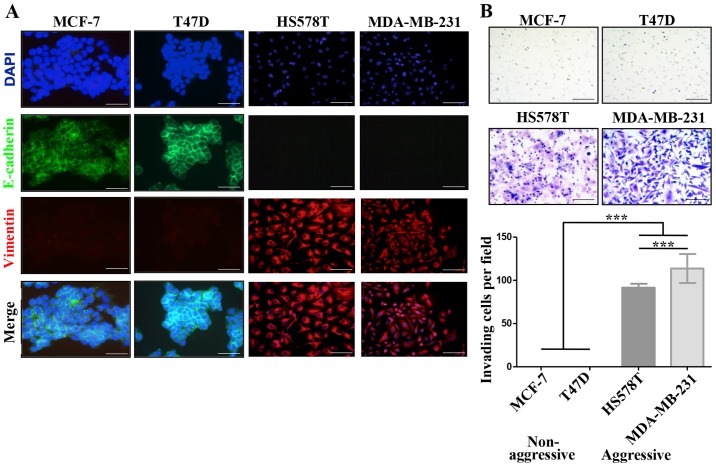
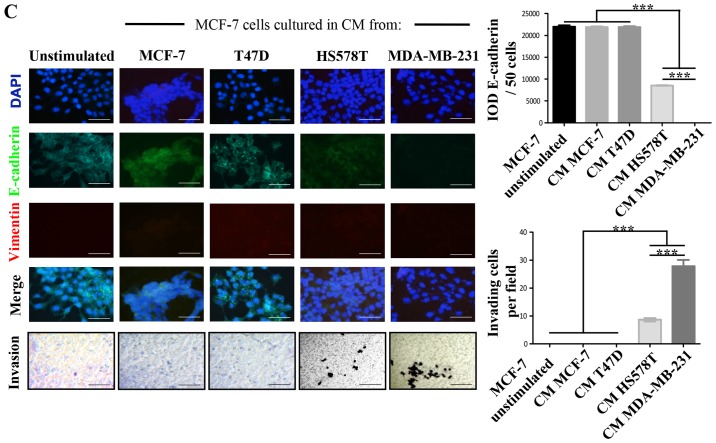
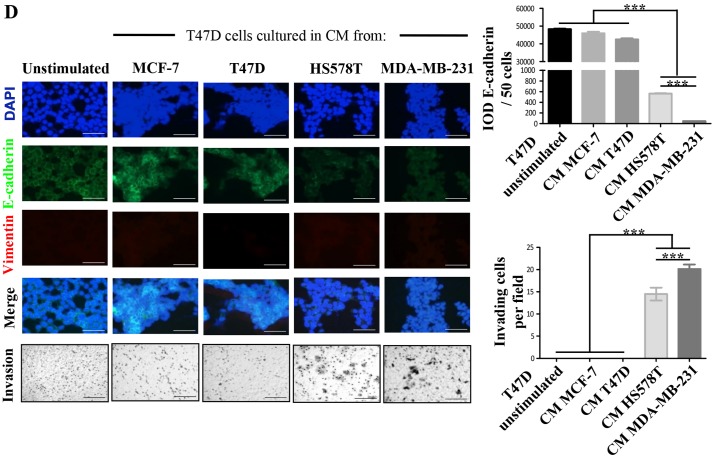
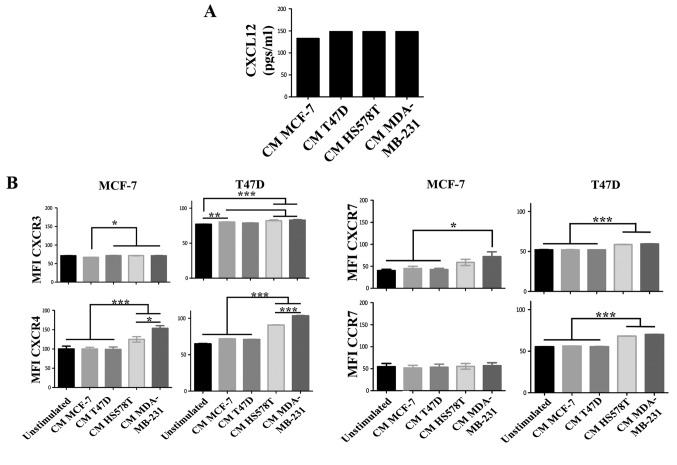
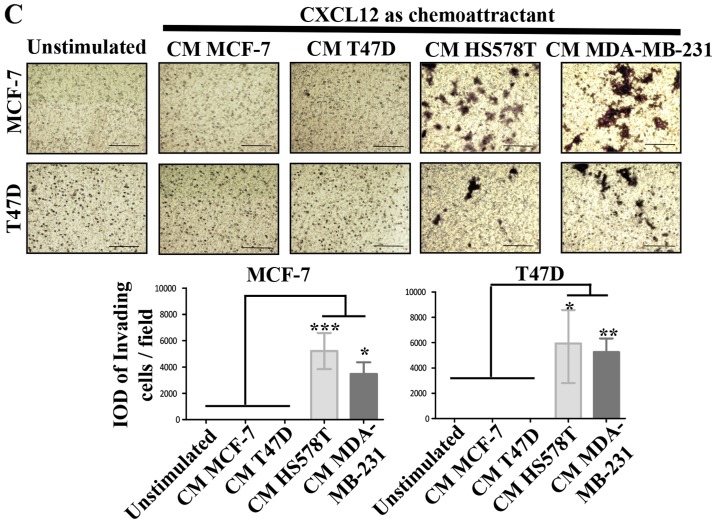
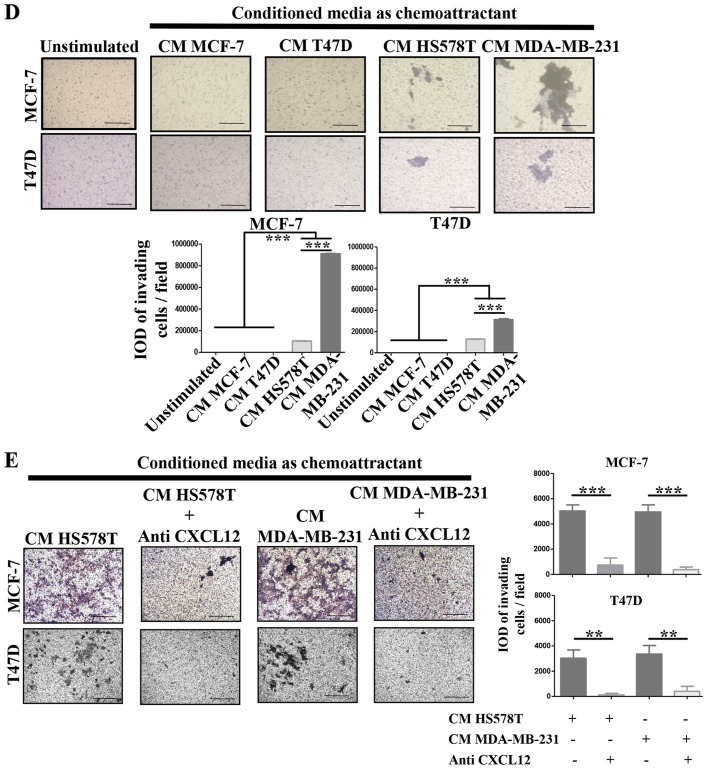
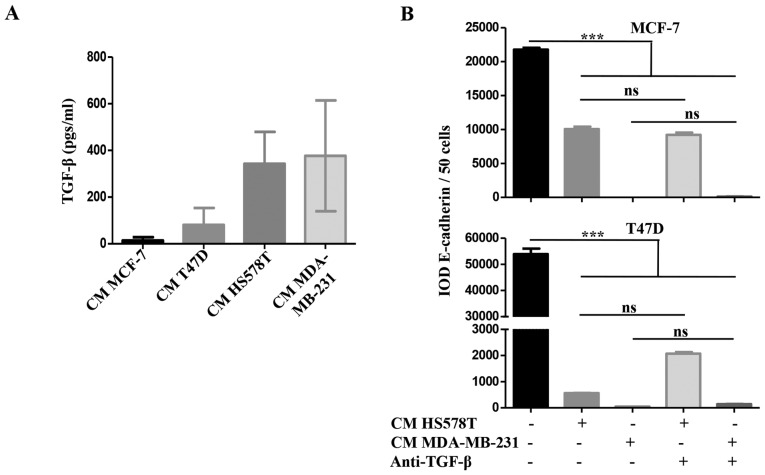
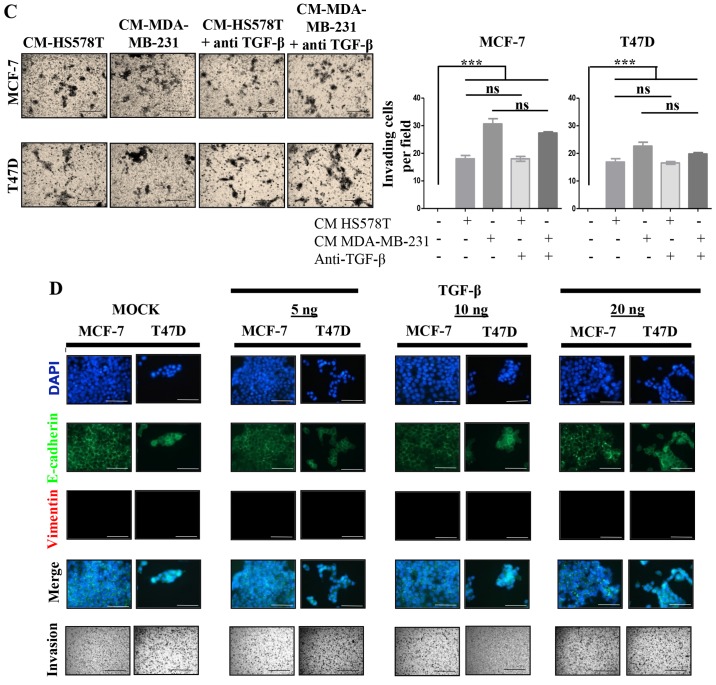
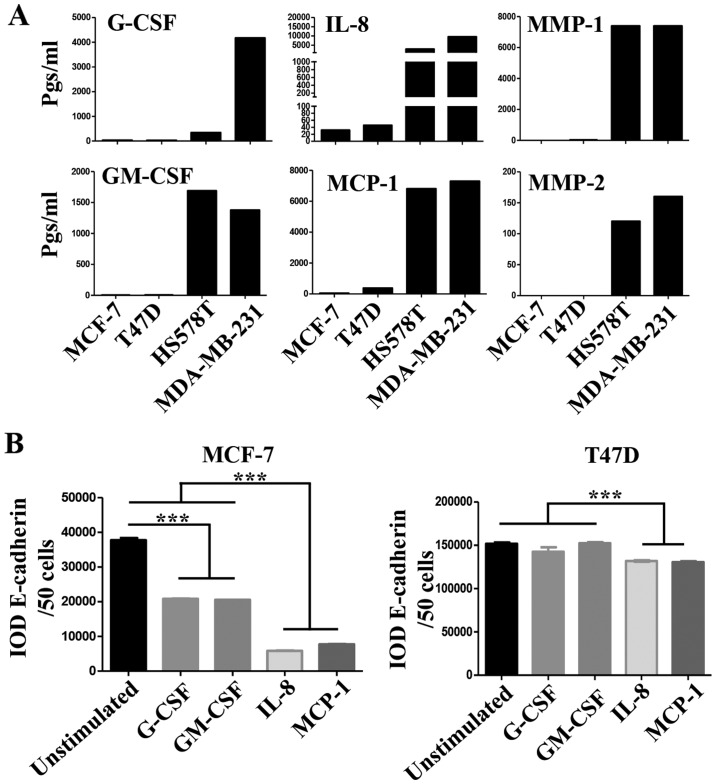
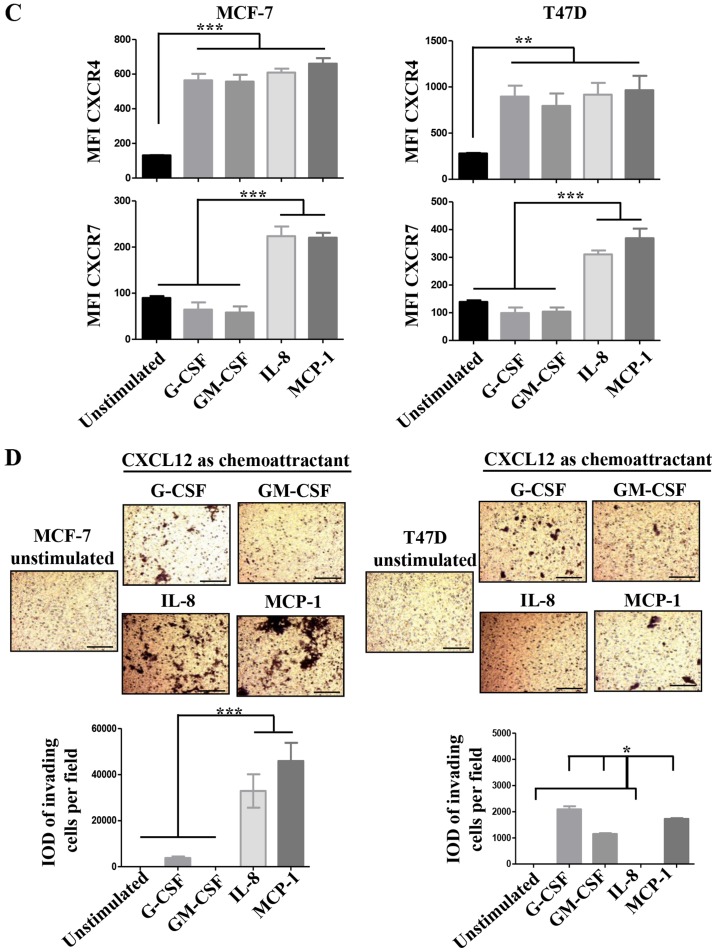
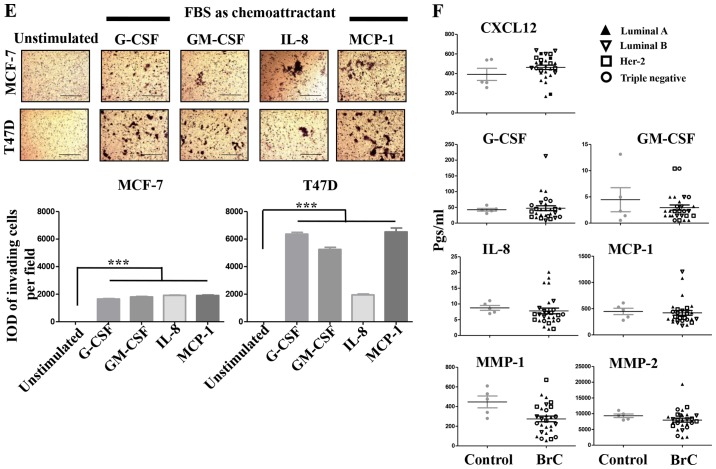
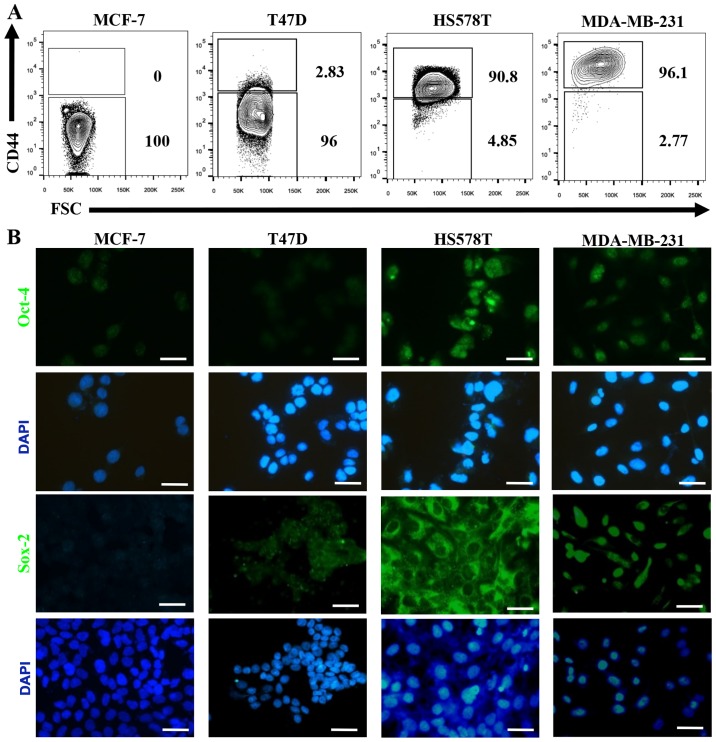
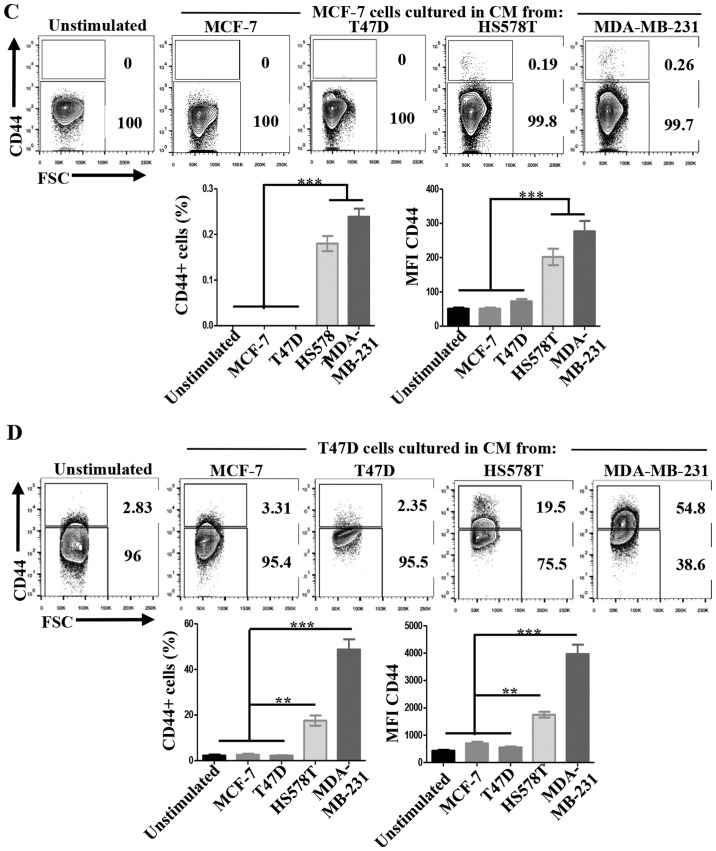
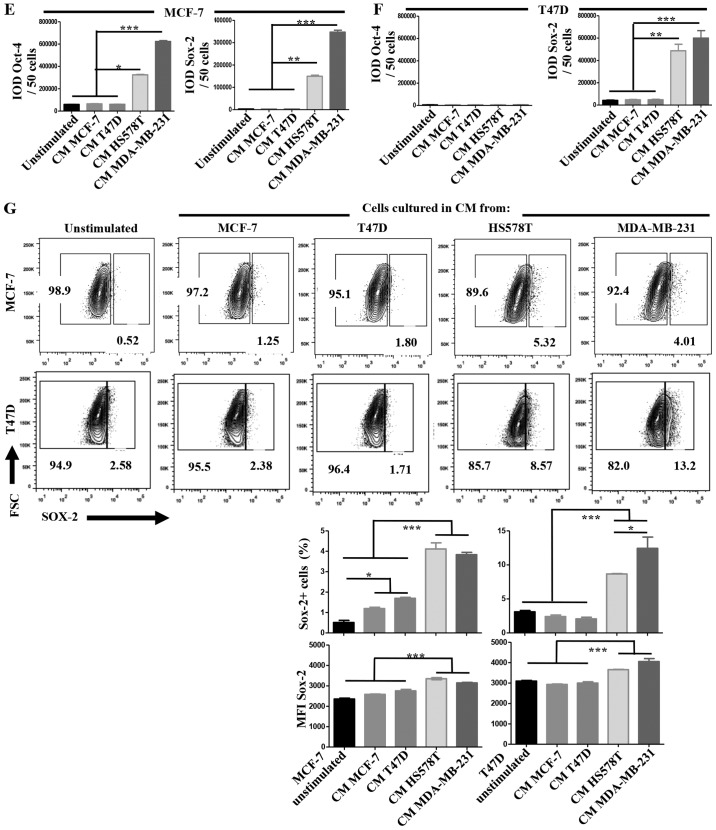
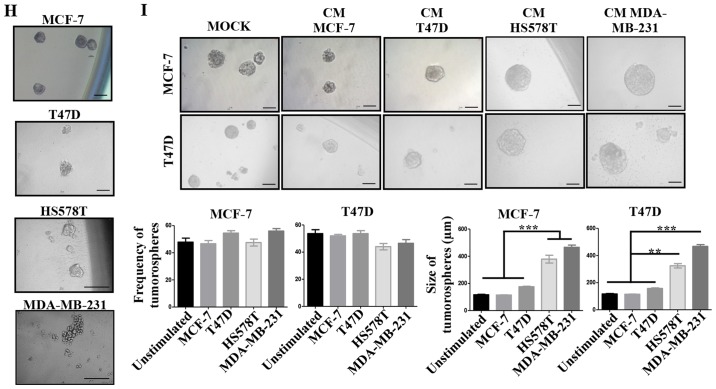
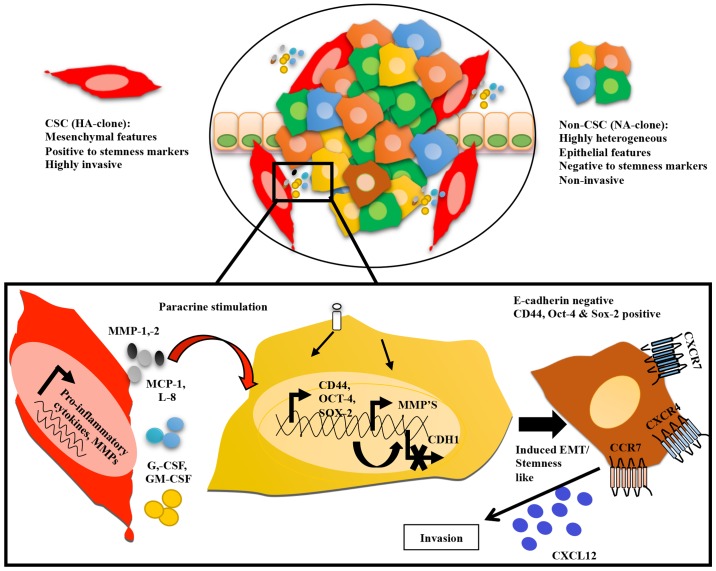
Breast cancer (BrC) is a major public health problem worldwide. The intra-tumoral heterogeneity and tumor cell plasticity importantly contribute to disease progression and treatment failure. However, the dynamic interactions between different tumor clones, as well as their contribution to tumor aggressiveness are still poorly understood. In this study, we provide evidence of a lateral transmission of aggressive features between aggressive and non-aggressive tumor cells, consisting of gain of expression of cancer stem cell markers, increased expression of CXCL12 receptors CXCR4 and CXCR7 and increased invasiveness in response to CXCL12, which correlated with high levels of secretion of pro-inflammatory mediators G-CSF, GM-CSF, MCP-1, IL-8 and metalloproteinases 1 and 2 by the aggressive cells. Noteworthy, we found no evidence of a TGF-β participation in the inducible-invasive phenotype. Altogether, our results provide evidence of communication between tumor cells with different potentials for aggressiveness, which could influence intra-tumoral population dynamics promoting the emergence of clones with novel functions. Understanding these interactions will provide better targets for diagnosis, prognosis and therapeutic strategies.


Figures

Figure 1
Figure 1
Aggressive breast cancer cells promote mesenchymal and invasive features in non-aggressive cells. (A) Analysis of the basal expression levels of epithelial to mesenchymal (EMT) markers E-cadherin (green) and vimentin (red), nuclei (DAPI, blue) by immunofluorescence (IF) staining. (B) Invasion assays. (C) MCF-7 cells were cultured with CM from HA-BrC cell lines HS578T and MDA-MB-231 for 72 h. As controls, MCF-7 cells were cultured with NA-BrC CMs or were cultured in their regular media (unstimulated). Left panels show representative IF images of EMT markers and optical images of invasion assays. Right panels show plots of the integrated optical density (IOD) of E-cadherin levels and the number of invasive cells. Aggressive breast cancer cells promote mesenchymal and invasive features in non-aggressive cells. (D) T47D cells were cultured with CM from HA-BrC cell lines HS578T and MDA-MB-231 for 72 h. As controls, T47D cells were cultured with NA-BrC CMs or were cultured in their regular media (unstimulated). Left panels show representative IF images of EMT markers and optical images of invasion assays. Right panels show plots of the integrated optical density (IOD) of E-cadherin levels and the number of invasive cells. Representative images are shown. Data represent the mean ± SEM (standard error of the mean) from 3 independent experiments; ***P<0.001. Scale bars indicate 100 µm. Magnification of ×400 for IF images and ×100 for optical images.
Figure 1
Figure 1
Aggressive breast cancer cells promote mesenchymal and invasive features in non-aggressive cells. (A) Analysis of the basal expression levels of epithelial to mesenchymal (EMT) markers E-cadherin (green) and vimentin (red), nuclei (DAPI, blue) by immunofluorescence (IF) staining. (B) Invasion assays. (C) MCF-7 cells were cultured with CM from HA-BrC cell lines HS578T and MDA-MB-231 for 72 h. As controls, MCF-7 cells were cultured with NA-BrC CMs or were cultured in their regular media (unstimulated). Left panels show representative IF images of EMT markers and optical images of invasion assays. Right panels show plots of the integrated optical density (IOD) of E-cadherin levels and the number of invasive cells. Aggressive breast cancer cells promote mesenchymal and invasive features in non-aggressive cells. (D) T47D cells were cultured with CM from HA-BrC cell lines HS578T and MDA-MB-231 for 72 h. As controls, T47D cells were cultured with NA-BrC CMs or were cultured in their regular media (unstimulated). Left panels show representative IF images of EMT markers and optical images of invasion assays. Right panels show plots of the integrated optical density (IOD) of E-cadherin levels and the number of invasive cells. Representative images are shown. Data represent the mean ± SEM (standard error of the mean) from 3 independent experiments; ***P<0.001. Scale bars indicate 100 µm. Magnification of ×400 for IF images and ×100 for optical images.
Figure 2
Figure 2
The CXCL12-CXCR4/CXCR7 axis in the inducible-invasive phenotype. (A) Levels of CXCL12 expressed in pgs/ml in the CMs of the BrC cell lines. (B) MCF-7 and T47D cells were cultured with CM from HA-BrC cell lines and controls, and expression of chemokine receptors was analyzed by flow cytometry. (C) CXCL12 or (D) CMs as chemoattractants. (E) CMs from the HA BrC cells were used as chemoattractants and 0.5 µg/ml of an anti-CXCL12 neutralizing antibody was added to the CMs. Invasive cells were quantified after 24 h (magnification of ×100). The integrated optical density (IOD) values of invading cells were plotted. Data represent the mean ± SEM from 3 independent experiments.; *P<0.05, **P<0.01 and ***P<0.001. Scale bars indicate 100 µm.
Figure 2
Figure 2
The CXCL12-CXCR4/CXCR7 axis in the inducible-invasive phenotype. (A) Levels of CXCL12 expressed in pgs/ml in the CMs of the BrC cell lines. (B) MCF-7 and T47D cells were cultured with CM from HA-BrC cell lines and controls, and expression of chemokine receptors was analyzed by flow cytometry. (C) CXCL12 or (D) CMs as chemoattractants. (E) CMs from the HA BrC cells were used as chemoattractants and 0.5 µg/ml of an anti-CXCL12 neutralizing antibody was added to the CMs. Invasive cells were quantified after 24 h (magnification of ×100). The integrated optical density (IOD) values of invading cells were plotted. Data represent the mean ± SEM from 3 independent experiments.; *P<0.05, **P<0.01 and ***P<0.001. Scale bars indicate 100 µm.
Figure 3
Figure 3
The inducible-invasive phenotype is TGF-β independent. (A) The concentration expressed in pgs/ml of TGF-β was measured in the CM from all BrC cell lines and data were plotted. The inducible-invasive phenotype of MCF-7 and T47D cells was activated with HA-BrC CMs in the presence of 2 µg/ml of neutralizing anti-TGF-β. After 72 h of culture, (B) EMT markers were analyzed by IF and IODs of E-cadherin expression were quantified and plotted. (C) Invasion assays were performed. Left panels show representative images of invading cells and right plots show the number of invading cells. (D) Analysis of EMT markers and invasion assays of NA-BrC cell lines treated with increasing concentrations of TGF-β. Representative images are shown. Data represents the mean ± SEM from 3 independent experiments; ***P<0.001; ns, non-significant. Scale bars indicate 100 µm, magnification of ×400 for IF and ×100 for invasion assays.
Figure 3
Figure 3
The inducible-invasive phenotype is TGF-β independent. (A) The concentration expressed in pgs/ml of TGF-β was measured in the CM from all BrC cell lines and data were plotted. The inducible-invasive phenotype of MCF-7 and T47D cells was activated with HA-BrC CMs in the presence of 2 µg/ml of neutralizing anti-TGF-β. After 72 h of culture, (B) EMT markers were analyzed by IF and IODs of E-cadherin expression were quantified and plotted. (C) Invasion assays were performed. Left panels show representative images of invading cells and right plots show the number of invading cells. (D) Analysis of EMT markers and invasion assays of NA-BrC cell lines treated with increasing concentrations of TGF-β. Representative images are shown. Data represents the mean ± SEM from 3 independent experiments; ***P<0.001; ns, non-significant. Scale bars indicate 100 µm, magnification of ×400 for IF and ×100 for invasion assays.
Figure 4
Figure 4
(A–D) The role of pro-inflammatory mediators in the inducible-invasive phenotype. (A) Milliplex assays were performed to determine the concentration of pro-inflammatory mediators and metalloproteinases (expressed in pgs/ml) in all the CMs; only analytes exhibiting significant differences between the CMs of NA- and HA-BrC cells are shown. MCF-7 and T47D cells were cultured with 100 ng/ml of any of the following: G-CSF, GM-CSF, IL-8 or MCP-1 for 72 h. (B) Analysis of the EMT marker E-cadherin by IF. (C) Plots of the analysis of CXCR4 and CXCR7 chemokine receptor expression by flow cytometry. Invasion assays using CXCL12 (D) as chemoattractant. Representative images and plots of resulting data are shown. Data represent the mean ± SEM from 3 independent experiments; *P<0.05, **P<0.01 and ***P<0.001. In the panels of T47D cells of (D), IL-8 was significantly different than the other cytokines (*P<0.05). Scale bars indicate 100 µm and magnification, ×100. (E and F) The role of pro-inflammatory mediators in the inducible-invasive phenotype. Invasion assays using fetal bovine serum (FBS) (E) as chemoattractant. (F) A Milliplex assay was performed to determine the sera concentration of the pro-inflammatory mediators and metalloproteinases of interest in BrC patients and controls. Representative images and plots of resulting data are shown. Data represent the mean ± SEM from 2 independent experiments; ***P<0.001. Only two duplicates were analyzed (F). Scale bars indicate 100 µm and magnification, ×100.
Figure 4
Figure 4
(A–D) The role of pro-inflammatory mediators in the inducible-invasive phenotype. (A) Milliplex assays were performed to determine the concentration of pro-inflammatory mediators and metalloproteinases (expressed in pgs/ml) in all the CMs; only analytes exhibiting significant differences between the CMs of NA- and HA-BrC cells are shown. MCF-7 and T47D cells were cultured with 100 ng/ml of any of the following: G-CSF, GM-CSF, IL-8 or MCP-1 for 72 h. (B) Analysis of the EMT marker E-cadherin by IF. (C) Plots of the analysis of CXCR4 and CXCR7 chemokine receptor expression by flow cytometry. Invasion assays using CXCL12 (D) as chemoattractant. Representative images and plots of resulting data are shown. Data represent the mean ± SEM from 3 independent experiments; *P<0.05, **P<0.01 and ***P<0.001. In the panels of T47D cells of (D), IL-8 was significantly different than the other cytokines (*P<0.05). Scale bars indicate 100 µm and magnification, ×100. (E and F) The role of pro-inflammatory mediators in the inducible-invasive phenotype. Invasion assays using fetal bovine serum (FBS) (E) as chemoattractant. (F) A Milliplex assay was performed to determine the sera concentration of the pro-inflammatory mediators and metalloproteinases of interest in BrC patients and controls. Representative images and plots of resulting data are shown. Data represent the mean ± SEM from 2 independent experiments; ***P<0.001. Only two duplicates were analyzed (F). Scale bars indicate 100 µm and magnification, ×100.
Figure 5
Figure 5
(A–D) The induced-invasive phenotype correlates with acquisition of stemness markers. Analysis of the basal expression levels of stemness markers: CD44 by flow cytometry (A), and of Oct-4 and Sox-2 by immunofluorescence (IF) (B). Rrepresentative images are shown. Scale bars indicate 100 µm (B). Magnification, ×400. Analysis of the expression levels of CD44 after induction of the invasive phenotype in MCF-7 (C) and T47D (D) cells. The upper panel shows CD44 expression and the lower panel shows plots of the frequency of CD44+ cells and the CD44 MFI. Data represent the mean ± SEM from 3 independent experiments, representative images are shown. **P<0.01 and ***P<0.001. (E–I) The induced-invasive phenotype correlates with acquisition of stemness markers. Analysis of Oct-4 and Sox-2 IODs is shown for MCF-7 (E) and T47D (F) cells. (G) Sox-2 was also examined by FACS; the upper panels show representative images of cell density plots, while the frequency of Sox-2 positive cells and the MFI of Sox-2 expression are graphed below. (H) The intrinsic sphere forming efficiency of the BrC cell lines was analyzed in ultra-low attachment plates, and (I) after induction of the invasive phenotype in MCF-7 and T47D cells. Plots of the frequency and size of the tumorspheres are shown. Data represent the mean ± SEM from 3 independent experiments, representative images are shown. *P<0.05, **P<0.01 and ***P<0.001. Scale bars indicate 50 µm for MCF-7 and T47D, and 100 µm for HS578T and MDA-MB-231 tumorspheres (H and I). Magnification, ×400.
Figure 5
Figure 5
(A–D) The induced-invasive phenotype correlates with acquisition of stemness markers. Analysis of the basal expression levels of stemness markers: CD44 by flow cytometry (A), and of Oct-4 and Sox-2 by immunofluorescence (IF) (B). Rrepresentative images are shown. Scale bars indicate 100 µm (B). Magnification, ×400. Analysis of the expression levels of CD44 after induction of the invasive phenotype in MCF-7 (C) and T47D (D) cells. The upper panel shows CD44 expression and the lower panel shows plots of the frequency of CD44+ cells and the CD44 MFI. Data represent the mean ± SEM from 3 independent experiments, representative images are shown. **P<0.01 and ***P<0.001. (E–I) The induced-invasive phenotype correlates with acquisition of stemness markers. Analysis of Oct-4 and Sox-2 IODs is shown for MCF-7 (E) and T47D (F) cells. (G) Sox-2 was also examined by FACS; the upper panels show representative images of cell density plots, while the frequency of Sox-2 positive cells and the MFI of Sox-2 expression are graphed below. (H) The intrinsic sphere forming efficiency of the BrC cell lines was analyzed in ultra-low attachment plates, and (I) after induction of the invasive phenotype in MCF-7 and T47D cells. Plots of the frequency and size of the tumorspheres are shown. Data represent the mean ± SEM from 3 independent experiments, representative images are shown. *P<0.05, **P<0.01 and ***P<0.001. Scale bars indicate 50 µm for MCF-7 and T47D, and 100 µm for HS578T and MDA-MB-231 tumorspheres (H and I). Magnification, ×400.
Figure 6
Figure 6
Working model. BrC is a heterogeneous disease with extensive intra-tumoral clonal diversity in which paracrine communication between different tumor clones influences the aggressive behavior of the tumor. Pro-inflammatory mediators, such as MCP-1, IL-8, GM-CSF and G-CSF, secreted by highly aggressive (HA) tumor clones have the potential to activate signaling pathways associated with aggressive behavior in non-aggressive (NA) clones. These paracrine intra-clonal communication results in the formation of populations with particular transcriptional profiles favoring processes related to the partial epithelial to mesenchymal transition (loss of E-cadherin but no gain of vimentin), stemness and invasion. Induced cells with acquired EMT/stemness like and invasion potential concur with upregulation of chemokine receptors, responding to HA-BrC (or other tumor stromal cells) secreted chemokines. In addition, paracrine secretion of metallo proteinases (MMPs) would facilitate the invasion of induced-clones trough degradation of the extracellular matrix. This mechanism may be critical to shape the tumor clinical outcome influencing metastasis, chemoresistance and disease relapse.

Similar articles

Cited by

References

    1. Bray F, Ren JS, Masuyer E, Ferlay J. Global estimates of cancer prevalence for 27 sites in the adult population in 2008. Int J Cancer. 2013;132:1133–1145. doi: 10.1002/ijc.27711. - DOI - PubMed
    1. Ferlay J, Soerjomataram I, Dikshit R, Eser S, Mathers C, Rebelo M, Parkin DM, Forman D, Bray F. Cancer incidence and mortality worldwide: Sources, methods and major patterns in GLOBOCAN 2012. Int J Cancer. 2015;136:E359–E386. doi: 10.1002/ijc.29210. - DOI - PubMed
    1. Sørlie T, Perou CM, Tibshirani R, Aas T, Geisler S, Johnsen H, Hastie T, Eisen MB, van de Rijn M, Jeffrey SS, et al. Gene expression patterns of breast carcinomas distinguish tumor subclasses with clinical implications. Proc Natl Acad Sci USA. 2001;98:10869–10874. doi: 10.1073/pnas.191367098. - DOI - PMC - PubMed
    1. Ng CKY, Pemberton HN, Reis-Filho JS. Breast cancer intratumor genetic heterogeneity: Causes and implications. Expert Rev Anticancer Ther. 2012;12:1021–1032. doi: 10.1586/era.12.85. - DOI - PubMed
    1. Chimal-Ramírez GK, Espinoza-Sánchez NA, Fuentes-Pananá EM. Protumor activities of the immune response: Insights in the mechanisms of immunological shift, oncotraining, and oncopromotion. J Oncol. 2013;2013:835956. doi: 10.1155/2013/835956. - DOI - PMC - PubMed

MeSH terms