

Regulation of ERK and AKT pathways by hepatitis B virus X protein via the Notch1 pathway in hepatocellular carcinoma
- PMID: 29048612
- PMCID: PMC5643068
- DOI: 10.3892/ijo.2017.4126
Regulation of ERK and AKT pathways by hepatitis B virus X protein via the Notch1 pathway in hepatocellular carcinoma
Abstract
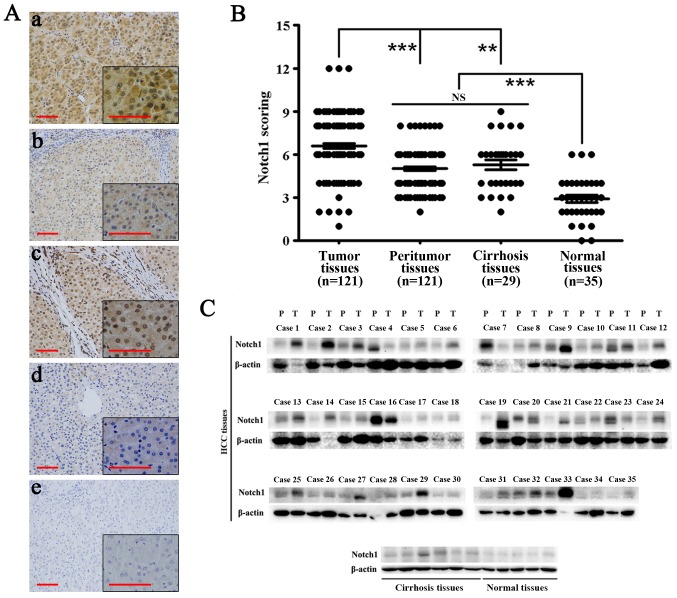
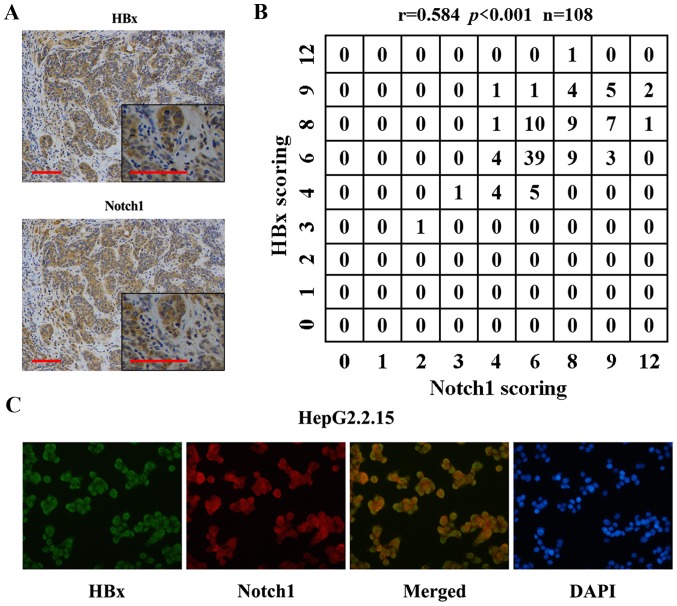
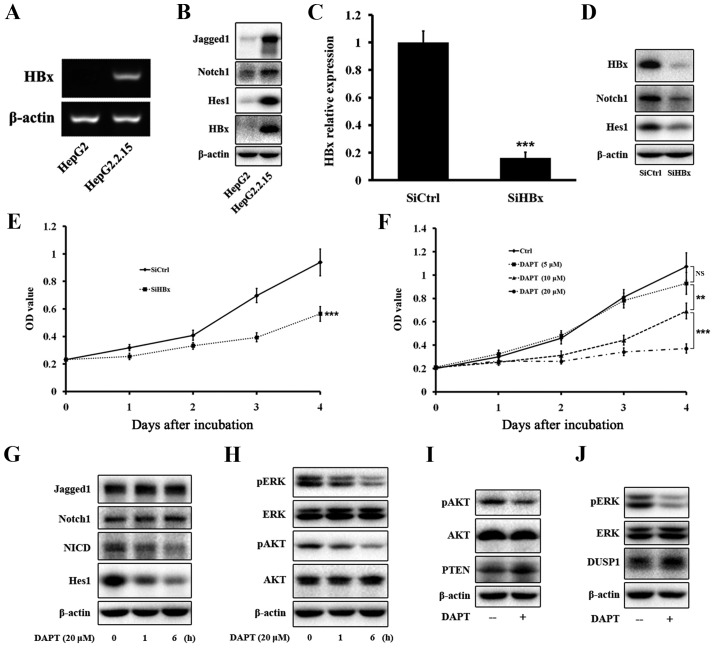
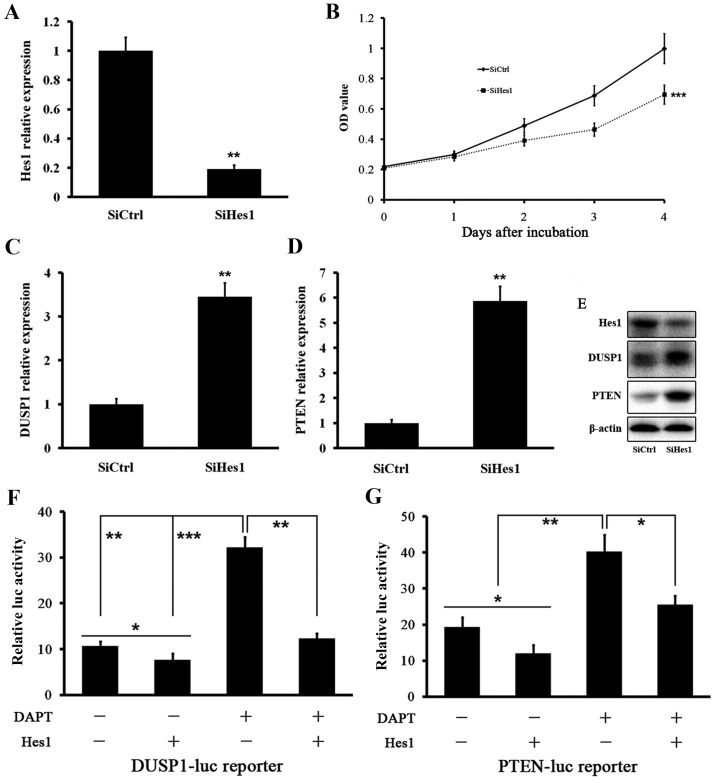
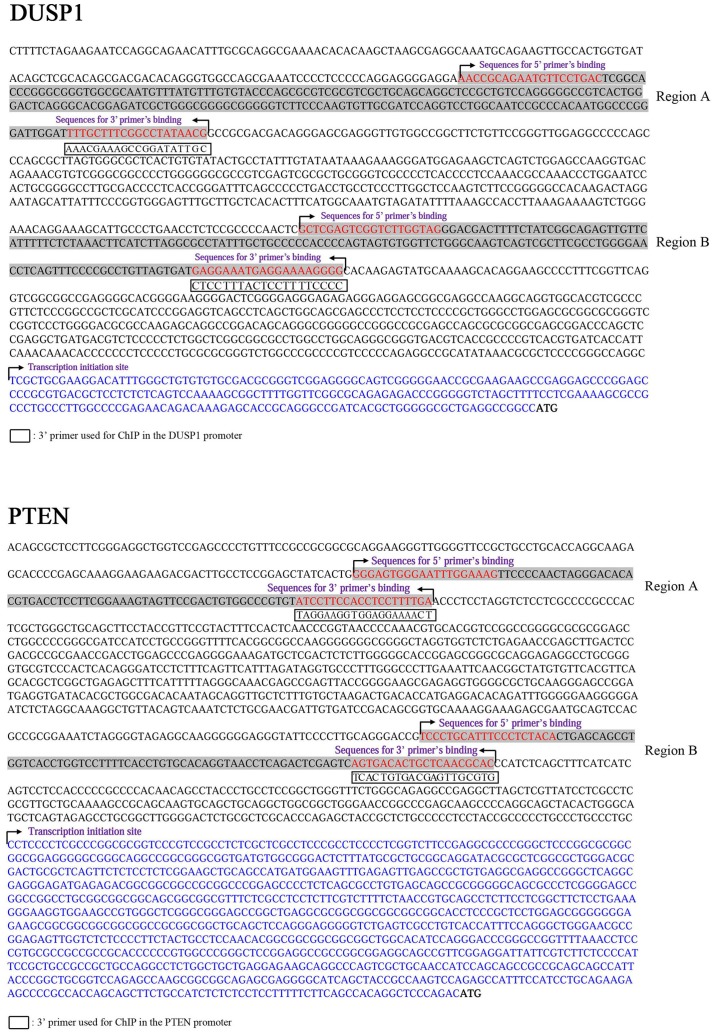
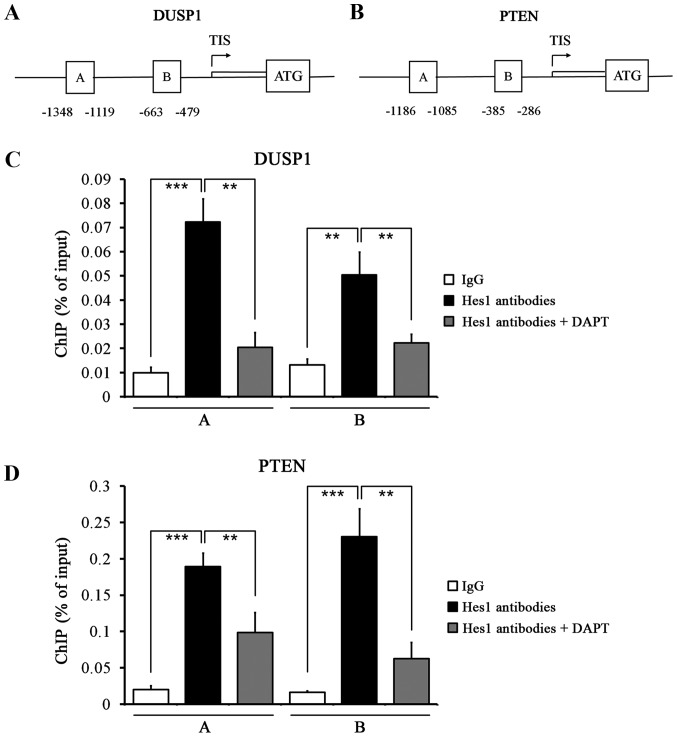
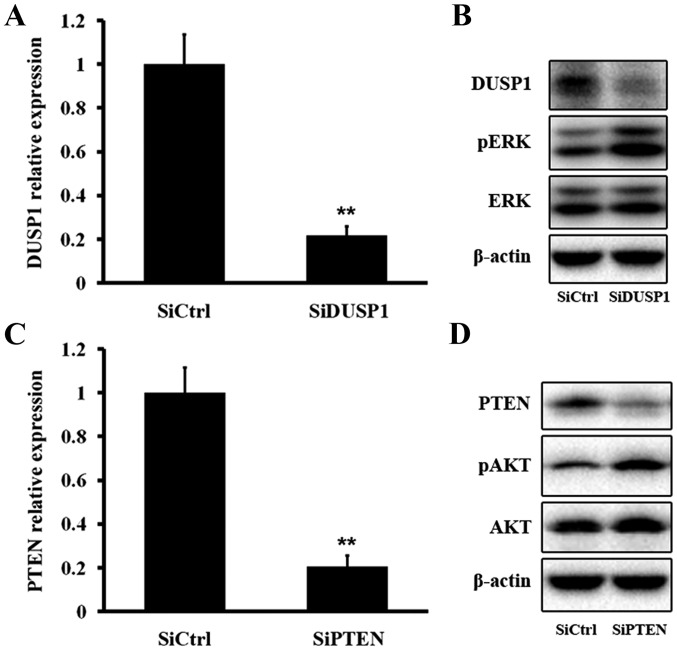
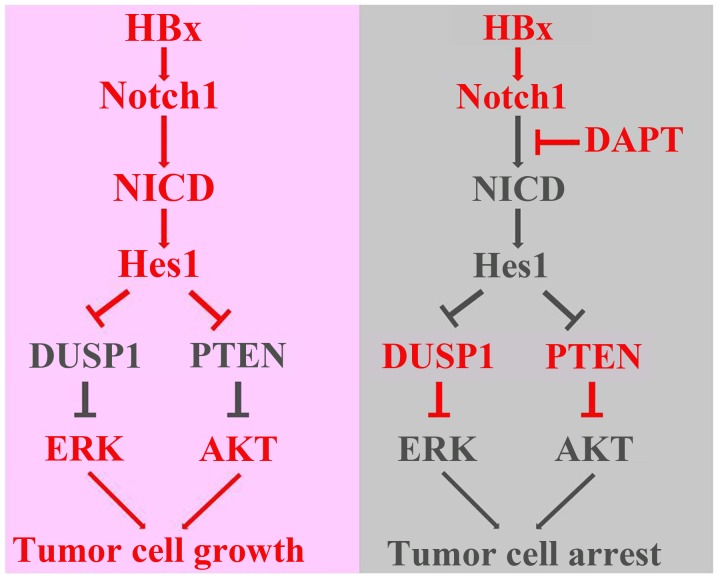
Hepatitis B virus (HBV) is the dominant risk factor for hepatocellular carcinoma (HCC). HBV X protein (HBx) plays crucial roles in HCC carcinogenesis. HBx interferes with several signaling pathways including the Notch1 pathway in HCC. In this study, we found that Notch1 was highly expressed in HCC, especially in large HCCs. Notch1 and HBx co-localized in HCC and their levels were positively correlated with each other. Notch1 expression was more elevated in HepG2.2.15 cells than that in HepG2 cells. HBx activated the Notch1 pathway in HepG2.2.15 cells. Suppression of HBx and the Notch1 pathway attenuated the growth of HepG2.2.15 cells. Notch1, ERK, and AKT pathways were inhibited after γ-secretase inhibitor treatment. Dual-specificity phosphatase 1 (DUSP1) and phosphatase and tensin homolog (PTEN) were upregulated after γ-secretase inhibitor treatment and Hes1 inhibition. Luciferase reporter assays showed that Hes1 suppressed the promoters of DUSP1 and PTEN genes, which was reversed by γ-secretase inhibitor treatment. Western blotting demonstrated that DUSP1 dephosphorylated pERK and PTEN dephosphorylated pAKT. Collectively, we found a link among HBx, the Notch1 pathway, DUSP1/PTEN, and ERK/AKT pathways, which influenced HCC cell survival and could be a therapeutic target for HCC treatment.
Figures
Similar articles
-
Hepatitis B virus X protein activates Notch signaling by its effects on Notch1 and Notch4 in human hepatocellular carcinoma.Int J Oncol. 2016 Jan;48(1):329-37. doi: 10.3892/ijo.2015.3221. Epub 2015 Oct 30. Int J Oncol. 2016. PMID: 26530164
-
MiR-19a, miR-122 and miR-223 are differentially regulated by hepatitis B virus X protein and involve in cell proliferation in hepatoma cells.J Transl Med. 2016 May 5;14(1):122. doi: 10.1186/s12967-016-0888-7. J Transl Med. 2016. PMID: 27150195 Free PMC article.
-
Hepatitis B virus X protein promotes interleukin-7 receptor expression via NF-κB and Notch1 pathway to facilitate proliferation and migration of hepatitis B virus-related hepatoma cells.J Exp Clin Cancer Res. 2016 Nov 7;35(1):172. doi: 10.1186/s13046-016-0448-2. J Exp Clin Cancer Res. 2016. PMID: 27821177 Free PMC article.
-
Hepatitis B virus x protein in the pathogenesis of hepatitis B virus-induced hepatocellular carcinoma.J Gastroenterol Hepatol. 2011 Jan;26 Suppl 1:144-52. doi: 10.1111/j.1440-1746.2010.06546.x. J Gastroenterol Hepatol. 2011. PMID: 21199526 Review.
-
Molecular mechanisms of HBV-associated hepatocarcinogenesis.Semin Liver Dis. 2013 May;33(2):147-56. doi: 10.1055/s-0033-1345721. Epub 2013 Jun 8. Semin Liver Dis. 2013. PMID: 23749671 Review.
Cited by
-
NAFLD and HBV interplay - related mechanisms underlying liver disease progression.Front Immunol. 2022 Dec 5;13:965548. doi: 10.3389/fimmu.2022.965548. eCollection 2022. Front Immunol. 2022. PMID: 36544761 Free PMC article. Review.
-
Expression of the Ebola Virus VP24 Protein Compromises the Integrity of the Nuclear Envelope and Induces a Laminopathy-Like Cellular Phenotype.mBio. 2021 Aug 31;12(4):e0097221. doi: 10.1128/mBio.00972-21. Epub 2021 Jul 6. mBio. 2021. PMID: 34225493 Free PMC article.
-
MiR-155-5p suppresses SOX1 to promote proliferation of cholangiocarcinoma via RAF/MEK/ERK pathway.Cancer Cell Int. 2021 Dec 7;21(1):656. doi: 10.1186/s12935-021-02374-0. Cancer Cell Int. 2021. PMID: 34876142 Free PMC article.
-
Evaluating the Effect of Lenvatinib on Sorafenib-Resistant Hepatocellular Carcinoma Cells.Int J Mol Sci. 2021 Dec 2;22(23):13071. doi: 10.3390/ijms222313071. Int J Mol Sci. 2021. PMID: 34884875 Free PMC article.
-
Mesenchymal stem cell-derived exosomes block malignant behaviors of hepatocellular carcinoma stem cells through a lncRNA C5orf66-AS1/microRNA-127-3p/DUSP1/ERK axis.Hum Cell. 2021 Nov;34(6):1812-1829. doi: 10.1007/s13577-021-00599-9. Epub 2021 Aug 24. Hum Cell. 2021. PMID: 34431063
References
MeSH terms
Substances
LinkOut - more resources
Full Text Sources
Other Literature Sources
Medical
Research Materials
Miscellaneous
