

Comparison of the efficacy of Gd-EOB-DTPA-enhanced magnetic resonance imaging and magnetic resonance elastography in the detection and staging of hepatic fibrosis
- PMID: 29049250
- PMCID: PMC5662416
- DOI: 10.1097/MD.0000000000008339
Comparison of the efficacy of Gd-EOB-DTPA-enhanced magnetic resonance imaging and magnetic resonance elastography in the detection and staging of hepatic fibrosis
Abstract
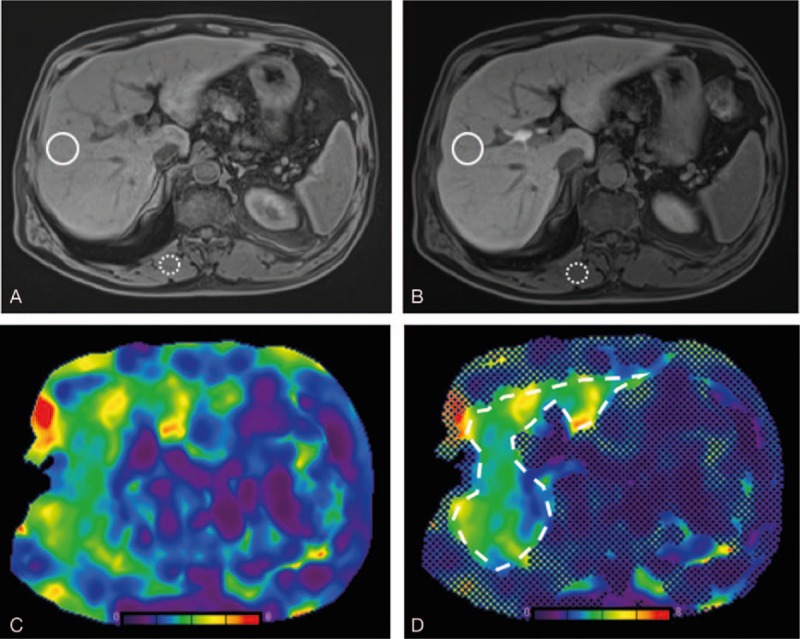
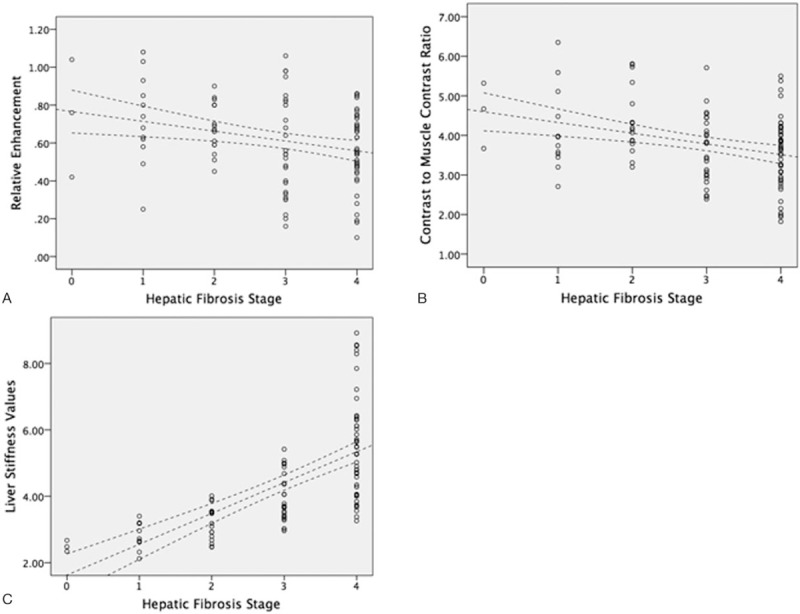
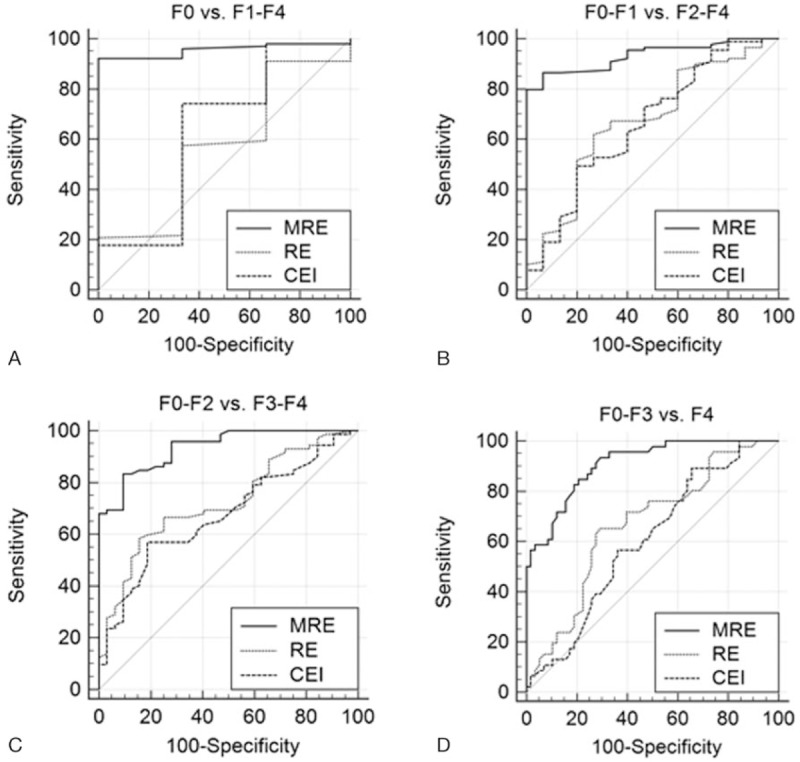
The present study compared the efficacy of gadolinium ethoxybenzyl diethylenetriamine pentaacetic acid (Gd-EOB-DTPA)-enhanced magnetic resonance imaging (MRI) and magnetic resonance elastography (MRE) in the estimation of hepatic fibrosis stages with histopathologic correlation.This retrospective study included 104 patients (87 men and 17 women; mean age, 60.6 ± 10.6 years) with chronic liver disease who underwent both Gd-EOB-DTPA-enhanced MRI and MRE. The relative enhancement (RE) ratio of the liver parenchyma and the contrast enhancement index (CEI) were calculated as (SIpostliver - SIpreliver)/SIpreliver and SIpost/SIpre, respectively, where SIpost and SIpre were the liver-to-muscle signal intensity ratios on the hepatobiliary phase images and noncontrast-enhanced images, respectively. The liver stiffness values were measured using MRE stiffness maps. The diagnostic performance of MRE, RE ratios, and CEI values for hepatic fibrosis staging were compared.The distribution of fibrosis stages was as follows: F0, n = 3 (2.9%); F1, n = 12 (11.5%); F2, n = 17 (16.3%); F3, n = 26 (25.0%); and F4, n = 46 (44.2%). MRE, RE ratios, and CEI values correlated significantly with hepatic fibrosis (rs = .79, -.35, -.25, respectively, P < .05). MRE showed a significantly higher diagnostic performance than did RE ratios and CEI values for each fibrosis stage, except while distinguishing the F1 fibrosis stage (CEI, P = .15). A cutoff value of RE ratio = 0.89 can be used to identify patients with significant hepatic fibrosis, with positive predictive value, sensitivity, specificity, and negative predictive value of 93.2%, 61.8%, 73.3%, and 24.4%, respectively.Gd-EOB-DTPA-enhanced MRI can potentially predict significant hepatic fibrosis. However, the diagnostic performance of MRE for hepatic fibrosis staging was superior to that of Gd-EOB-DTPA-enhanced MRI.
Conflict of interest statement
The authors report no conflicts of interest.
Figures
Similar articles
-
Gadolinium-ethoxybenzyl-diethylenetriamine penta-acetic acid-enhanced magnetic resonance imaging for evaluating fibrosis regression in chronic hepatitis C patients after direct-acting antiviral.World J Gastroenterol. 2022 May 28;28(20):2214-2226. doi: 10.3748/wjg.v28.i20.2214. World J Gastroenterol. 2022. PMID: 35721884 Free PMC article.
-
Comparison of magnetic resonance elastography and gadoxetate disodium-enhanced magnetic resonance imaging for the evaluation of hepatic fibrosis.Invest Radiol. 2013 Aug;48(8):607-13. doi: 10.1097/RLI.0b013e318289ff8f. Invest Radiol. 2013. PMID: 23538889
-
Prospective comparison of diffusion-weighted MRI and dynamic Gd-EOB-DTPA-enhanced MRI for detection and staging of hepatic fibrosis in primary sclerosing cholangitis.Eur Radiol. 2019 Feb;29(2):818-828. doi: 10.1007/s00330-018-5614-9. Epub 2018 Jul 16. Eur Radiol. 2019. PMID: 30014204
-
Gadoxetate-disodium-enhanced magnetic resonance imaging for liver fibrosis staging: a systematic review and meta-analysis.Clin Radiol. 2020 Apr;75(4):319.e11-319.e19. doi: 10.1016/j.crad.2019.11.001. Epub 2019 Dec 9. Clin Radiol. 2020. PMID: 31831141
-
Liver Fibrosis Staging with Gadolinium Ethoxybenzyl Diethylenetriamine Penta-Acetic Acid-enhanced: A Systematic Review and Meta-analysis.Curr Med Imaging. 2021;17(7):854-863. doi: 10.2174/1573405616666201130101229. Curr Med Imaging. 2021. PMID: 33256584
Cited by
-
Diagnostic value of spleen stiffness by magnetic resonance elastography for prediction of esophageal varices in cirrhotic patients.Abdom Radiol (NY). 2021 Feb;46(2):526-533. doi: 10.1007/s00261-020-02628-x. Epub 2020 Jul 16. Abdom Radiol (NY). 2021. PMID: 32676734
-
Gadolinium-ethoxybenzyl-diethylenetriamine penta-acetic acid-enhanced magnetic resonance imaging for evaluating fibrosis regression in chronic hepatitis C patients after direct-acting antiviral.World J Gastroenterol. 2022 May 28;28(20):2214-2226. doi: 10.3748/wjg.v28.i20.2214. World J Gastroenterol. 2022. PMID: 35721884 Free PMC article.
-
Noninvasive imaging biomarkers for liver fibrosis in nonalcoholic fatty liver disease: current and future.Clin Mol Hepatol. 2023 Feb;29(Suppl):S136-S149. doi: 10.3350/cmh.2022.0436. Epub 2022 Dec 12. Clin Mol Hepatol. 2023. PMID: 36503205 Free PMC article. Review.
-
Advances in non-invasive assessment of hepatic fibrosis.Gut. 2020 Jul;69(7):1343-1352. doi: 10.1136/gutjnl-2018-317593. Epub 2020 Feb 17. Gut. 2020. PMID: 32066623 Free PMC article. Review.
-
Diagnostic accuracy of magnetic resonance elastography and point-shear wave elastography for significant hepatic fibrosis screening: Systematic review and meta-analysis.PLoS One. 2023 Feb 2;18(2):e0271572. doi: 10.1371/journal.pone.0271572. eCollection 2023. PLoS One. 2023. PMID: 36730265 Free PMC article.
References
-
- Alcolado R, Arthur MJ, Iredale JP. Pathogenesis of liver fibrosis. Clin Sci 1997;92:103–12. - PubMed
-
- Strader DB, Wright T, Thomas DL, et al. Diagnosis, management, and treatment of hepatitis C. Hepatology 2004;39:1147–71. - PubMed
-
- Merican I, Guan R, Amarapuka D, et al. Chronic hepatitis B virus infection in Asian countries. J Gastroenterol Hepatol 2000;15:1356–61. - PubMed
-
- Kao JH. Hepatitis C virus infection in Taiwan: past, present, and future. J Formos Med Assoc 2016;115:65–6. - PubMed
MeSH terms
Substances
LinkOut - more resources
Full Text Sources
Other Literature Sources
Medical
Miscellaneous
