

Truncated hemoglobin 1 is a new player in Chlamydomonas reinhardtii acclimation to sulfur deprivation
- PMID: 29049377
- PMCID: PMC5648252
- DOI: 10.1371/journal.pone.0186851
Truncated hemoglobin 1 is a new player in Chlamydomonas reinhardtii acclimation to sulfur deprivation
Abstract
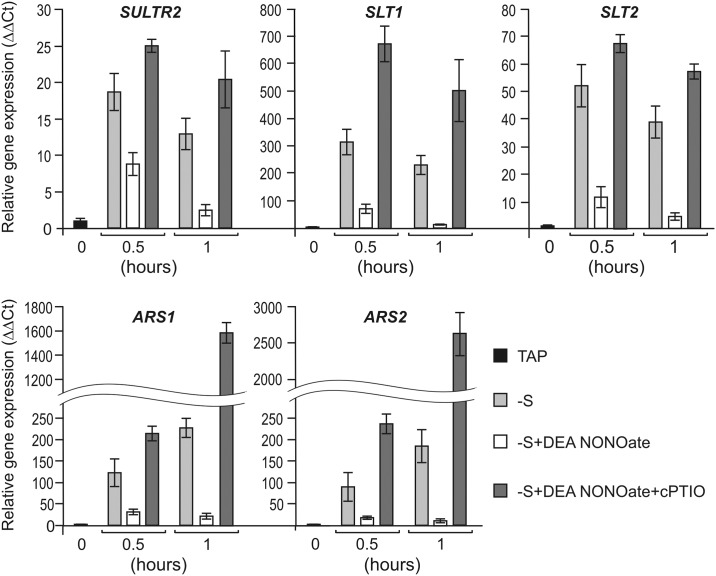
Truncated hemoglobins constitute a large family, present in bacteria, in archaea and in eukaryotes. However, a majority of physiological functions of these proteins remains to be elucidated. Identification and characterization of a novel role of truncated hemoglobins in the model alga provides a framework for a more complete understanding of their biological functions. Here, we use quantitative RT-PCR to show that three truncated hemoglobins of Chlamydomonas reinhardtii, THB1, THB2 and THB12, are induced under conditions of depleted sulfur (S) supply. THB1 underexpression results in the decrease in cell size, as well in levels of proteins, chlorophylls and mRNA of several S-responsive genes under S starvation. We provide evidence that knock-down of THB1 enhances NO production under S deprivation. In S-deprived cells, a subset of S limitation-responsive genes is controlled by NO in THB1-dependent pathway. Moreover, we demonstrate that deficiency for S represses the nitrate reduction and that THB1 is involved in this control. Thus, our data support the idea that in S-deprived cells THB1 plays a dual role in NO detoxification and in coordinating sulfate limitation with nitrate assimilation. This study uncovers a new function for the Chlamydomonas reinhardtii THB1 in the control of proper response to S deprivation.
Conflict of interest statement
Figures


Similar articles
-
THB1, a truncated hemoglobin, modulates nitric oxide levels and nitrate reductase activity.Plant J. 2015 Feb;81(3):467-79. doi: 10.1111/tpj.12744. Plant J. 2015. PMID: 25494936
-
Truncated Hemoglobins 1 and 2 Are Implicated in the Modulation of Phosphorus Deficiency-Induced Nitric Oxide Levels in Chlamydomonas.Cells. 2019 Aug 21;8(9):947. doi: 10.3390/cells8090947. Cells. 2019. PMID: 31438612 Free PMC article.
-
THB1 regulates nitrate reductase activity and THB1 and THB2 transcription differentially respond to NO and the nitrate/ammonium balance in Chlamydomonas.Plant Signal Behav. 2015;10(8):e1042638. doi: 10.1080/15592324.2015.1042638. Plant Signal Behav. 2015. PMID: 26252500 Free PMC article.
-
Insights into the acclimation of Chlamydomonas reinhardtii to sulfur deprivation.Photosynth Res. 2005 Dec;86(3):475-89. doi: 10.1007/s11120-005-4048-9. Epub 2005 Nov 15. Photosynth Res. 2005. PMID: 16307308 Review.
-
Acclimation of Chlamydomonas reinhardtii to its nutrient environment.Protist. 2000 Oct;151(3):201-24. doi: 10.1078/1434-4610-00020. Protist. 2000. PMID: 11079767 Review.
Cited by
-
Nitric Oxide Remodels the Photosynthetic Apparatus upon S-Starvation in Chlamydomonas reinhardtii.Plant Physiol. 2019 Feb;179(2):718-731. doi: 10.1104/pp.18.01164. Epub 2018 Dec 10. Plant Physiol. 2019. PMID: 30530737 Free PMC article.
-
Dual positive and negative control of Chlamydomonas PII signal transduction protein expression by nitrate/nitrite and NO via the components of nitric oxide cycle.BMC Plant Biol. 2018 Nov 27;18(1):305. doi: 10.1186/s12870-018-1540-x. BMC Plant Biol. 2018. PMID: 30482162 Free PMC article.
-
Lysine as a heme iron ligand: A property common to three truncated hemoglobins from Chlamydomonas reinhardtii.Biochim Biophys Acta Gen Subj. 2018 Dec;1862(12):2660-2673. doi: 10.1016/j.bbagen.2018.08.009. Epub 2018 Aug 10. Biochim Biophys Acta Gen Subj. 2018. PMID: 30251657 Free PMC article.
-
Nitric Oxide in Plant Functioning: Metabolism, Signaling, and Responses to Infestation with Ecdysozoa Parasites.Biology (Basel). 2023 Jun 28;12(7):927. doi: 10.3390/biology12070927. Biology (Basel). 2023. PMID: 37508359 Free PMC article. Review.
-
Distinctive structural properties of THB11, a pentacoordinate Chlamydomonas reinhardtii truncated hemoglobin with N- and C-terminal extensions.J Biol Inorg Chem. 2020 Mar;25(2):267-283. doi: 10.1007/s00775-020-01759-2. Epub 2020 Feb 11. J Biol Inorg Chem. 2020. PMID: 32048044 Free PMC article.
References
-
- Vinogradov SN, Moens L. Diversity of globin function: Enzymatic, transport, storage, and sensing. J Biol Chem. 2008; 283: 8773–8777. doi: 10.1074/jbc.R700029200 - DOI - PubMed
-
- Garrocho-Villegas V, Gopalasubramaniam SK, Arredondo-Peter R. Plant hemoglobins: what we know six decades after their discovery. Gene. 2007; 398: 78–85. doi: 10.1016/j.gene.2007.01.035 - DOI - PubMed
-
- Hoy JA, Hargrove MS. The structure and function of plant hemoglobins. Plant Physiol Biochem. 2008; 46: 371–379. doi: 10.1016/j.plaphy.2007.12.016 - DOI - PubMed
-
- Vázquez-Limón C, Hoogewijs D, Vinogradov SN, Arredondo-Peter R. The evolution of land plant hemoglobins. Plant Sci. 2012; 191–192: 71–81. doi: 10.1016/j.plantsci.2012.04.013 - DOI - PubMed
-
- Wittenberg JB, Bolognesi M, Wittenberg BA, Guertin M. Truncated hemoglobins: a new family of hemoglobins widely distributed in bacteria, unicellular eukaryotes, and plants. J Biol Chem. 2002; 277: 871–874. doi: 10.1074/jbc.R100058200 - DOI - PubMed
MeSH terms
Substances
LinkOut - more resources
Full Text Sources
Other Literature Sources
