. 2017 Oct 19;12(10):e0186584.
doi: 10.1371/journal.pone.0186584. eCollection 2017.

Reversible differentiation of immortalized human bladder smooth muscle cells accompanied by actin bundle reorganization

Affiliations

Reversible differentiation of immortalized human bladder smooth muscle cells accompanied by actin bundle reorganization

Naohiro Hashimoto et al. PLoS One. .

Abstract

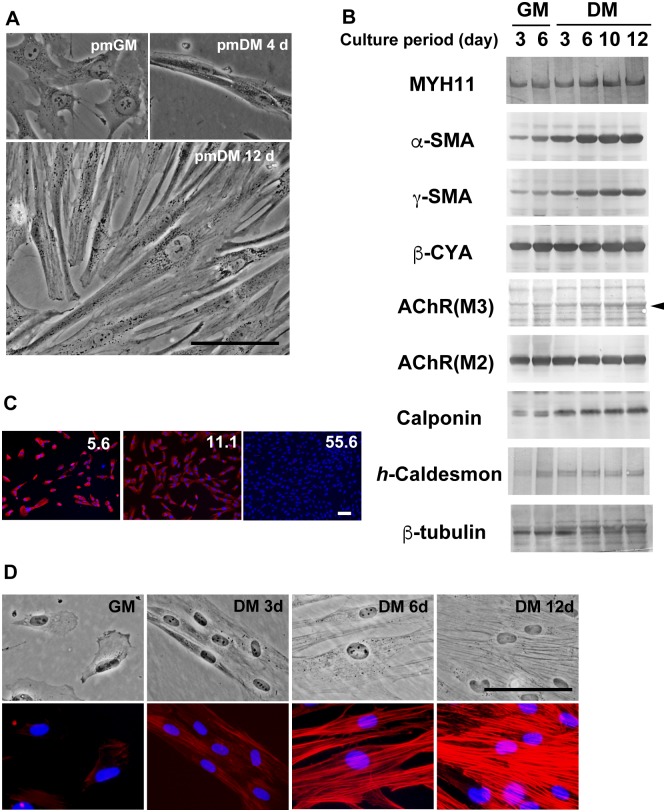
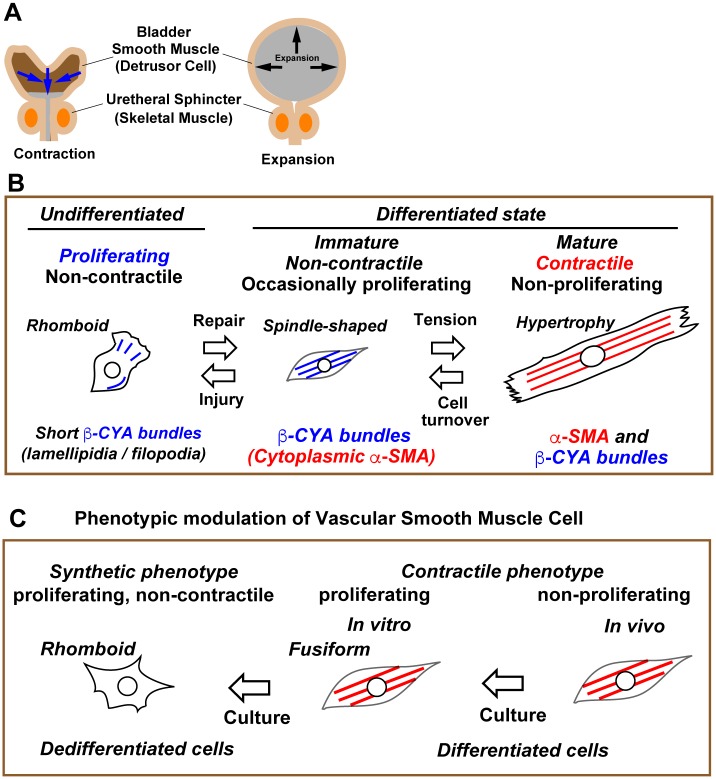
Previous studies have shown that phenotypic modulation of smooth muscle cells (SMCs) plays a pivotal role in human diseases. However, the molecular mechanisms underlying the reversible differentiation of SMCs remain elusive particularly because cultured SMCs that reproducibly exhibit bidirectional phenotypic modulation have not been established. Here we established an immortalized human bladder SMC line designated as hBS11. Under differentiation-inducing conditions, hBS11 cells underwent smooth muscle differentiation accompanied by the robust expression of smooth muscle differentiation markers and isoform-dependent reorganization of actin bundles. The cholinergic receptor agonist carbachol increased intracellular calcium in differentiated hBS11 cells in an acetylcholine muscarinic receptor-dependent manner. Differentiated hBS11 cells displayed contractile properties depending on the elevation in the levels of intracellular calcium. Depolarization of membrane potential triggered inward sodium current in differentiated hBS11 cells. However, differentiated hBS11 cells lost the differentiated phenotype and resumed mitosis when re-fed with growth medium. Our study provides direct evidence pertaining to the human bladder SMCs being able to retain the capacity of reversible differentiation and that the reorganization of actin bundles is involved in the reinstatement of contractility. Moreover, we have established a human SMC line retaining high proliferating potential without compromising differentiation potential.


Conflict of interest statement

Competing Interests: The authors declare no competing financial interests. There are no patents or any other benefits to PromoCell upon publication of this paper. The authors also state that no conflict of interest will arise with regard to the company that will be selling the immortalized human SMC cell line hBS11 in future.

Figures

Fig 1
Fig 1. Growth properties of immortalized human bladder smooth muscle cells.
(A-C) Morphological features of human bladder smooth muscle cells. Parental primary cultured human bladder smooth muscle cells at passage 2 (A) in Smooth Muscle Cell Growth Medium 2 contained heterogeneous cell populations that included compact cells (arrow heads) and spreading cells (arrows). Parental primary cultured human bladder smooth muscle cells at passage 7 (B) contained extensively spreading cells (arrows) and a loss of proliferative potential even when cultured in pmGM. Immortalized human bladder smooth muscle hBS11cells (C) exhibited a compact and rhomboid shape. Arrow heads represent mitotic cells. The images in (A-C) are shown at the same magnification. Scale bar, 50 μm. (D) Optimization of culture medium components for the growth of immortalized human bladder smooth muscle cells. hBS11 cells were plated in Dulbecco’s modified Eagle’s medium–high glucose (hDMEM) supplemented with 10% FBS. The next day (day 0), the medium was switched to a test medium, and cells were cultured for another 3 days. The number of nuclei was counted and normalized to the day 0 values. Averages and standard deviations were estimated from four independent cultures for each treatment. hDMEM was used as a basal medium except for SMC-GM2. FBS, fetal bovine serum; ULG, 2% Ultroser G. (E) The lifespan of immortalized human bladder smooth muscle cells. The number of multiclonal cells (hBS11) between passage 7 and 19 was calculated. Day 0 of the culture period represents when the cells were plated for passage 7. The fold increase was estimated by normalizing to the cell number at day 0. (F) Karyotype analysis of immortalized human bladder smooth muscle cells. hBS11 cells (passages 11 and 12) were treated with colcemid (0.5 μM) for 3 h. Metaphase chromosomes 46, XY were visualized using Giemsa staining.
Fig 2
Fig 2. Smooth muscle differentiation of immortalized human bladder smooth muscle cells.
(A) hBS11 cells were cultured in pmGM for 3 days or pmDM for 4 and 12 days. Phase contrast images were taken at the same magnification. Scale bar, 100 μm. (B) hBS11 cells were cultured in pmGM for 3 and 6 days or pmDM for 3, 6, 10, and 12 days. Ten micrograms of total protein was subjected to immunoblotting analysis with antibodies for myosin heavy chain 11 (MYH11), α-smooth muscle actin (α-SMA), γ-smooth muscle actin (γ-SMA), β-cytoplasmic actin (β-CYA), acetylcholine muscarinic receptor 3 (Ach(M3)), acetylcholine muscarinic receptor 2 (Ach(M2)), calponin, h-caldesmon, and β-tubulin. (C) hBS11 cells were plated at a density of 5.6, 11.1, or 55.6 cells/mm2 in hDMEM supplemented with 20% FBS. The cells were then cultured in pmDM for 6 days. The cells were subjected to immunofluorescence analysis with antibodies for α-SMA (red). Nuclei were stained with DAPI (blue). Scale bar, 100 μm. (D) hBS11 cells were cultured in pmGM for 3 days or pmDM for 3, 6, and 12 days. Phase contrast images (upper row) and fluorescent images with Alexa 546-conjugated phalloidin (red in lower row) of the same fields are shown in each column. Nuclei were stained with DAPI (blue in lower row). Scale bar, 100 μm.
Fig 3
Fig 3. Isoform-dependent reorganization of actin bundles during bladder smooth muscle cell differentiation.
(A) hBS11 cells were cultured in pmGM for 3 days or pmDM for 3, 6, 9, and 12 days, and then subjected to immunofluorescence analysis with antibodies for connexin 43 (green in top row), β-CYA (green in middle row) and α-SMA (green in lower row). Filamentous actin was visualized with Alexa 546-conjugated phalloidin (red in upper row). Nuclei were stained with DAPI (blue). Scale bar, 50 μm. (B) hBS11 cells were cultured for 6 days in pmDM and then subjected to immunofluorescent analysis with antibodies for α-SMA (c). Filamentous actin was visualized with Alexa 546-conjugated phalloidin (b). Nuclei were stained with DAPI (blue). The merged image was shown in (a). Arrows represent a hypertrophic cell containing α-SMA-positive actin bundles. Scale bars, 50 μm. (C) hBS11 cells were cultured in pmDM for 12 days and then subjected to immunofluorescence analysis with antibodies for β-CYA (green in upper and middle rows), and α-SMA (red in middle and lower rows), and γ-SMA (green in lower row). Filamentous actin was visualized with Alexa 546-conjugated phalloidin (red in upper row). Nuclei were stained with DAPI (blue). Scale bar, 50 μm. Merged images are shown in the left column. (D) hBS11 cells were cultured in pmGM for 3 and 6 days or pmDM for 6 and 12 days, and then subjected to quantification of globular (G-actin) and filamentous (F-actin) forms. Fractions of G- and F-actin prepared from 10 μg of total proteins were quantified by immunoblotting analysis with isoform-specific antibodies for α-SMA, γ-SMA and β-CYA. The signal intensity of each band was quantified with Image J software and shown as arbitrary units. Total actin represents the sum of [G-actin] and [F-actin], and [% F-/Total] represents the ratio of F-actin in each isoform.
Fig 4
Fig 4. Calcium increase in immortalized human bladder smooth muscle cells.
(A) Differentiated hBS11 cells were preloaded with a calcium sensitive dye Fluo-4 AM, and then stimulated with a cholinergic agonist carbachol (1 mM). The cells were observed under epifluorescence microscopy. Fluorescent images correspond to the frames 2, 5, 10, 20, 31, and 37 of S3 Video. Scale bar, 10 μm. (B) Differentiated hBS11 cells were treated as described in (A). The cells were observed under phase contrast and epifluorescence microscopy. The phase contrast image was taken before stimulation with carbachol. Fluorescent images correspond to the frames 28 and 34 of S4 Video. A circle represents a cell-to-cell contact region between neighboring cells named #1 and #2 in a phase contrast image before carbachol stimulation (left panel). Calcium signaling was conducted between neighboring cells (middle and right panels). (C) hBS11 cells were preloaded with Fluo-4 AM for 1 h on day 14 or 19 of differentiation culture and then stimulated with a cholinergic agonist carbachol (50 μM) for 30 s. Digital fluorescent imaging was obtained using a two-photon confocal microscope. ΔF/F0 represents percent changes in the fluorescence intensity over resting levels. (a) Effect of the muscarinic receptor antagonist atropine (5 μM) on carbachol-induced intracellular Ca2+ elevation. Horizontal bar represents the period of exposure to carbachol. F/F0 of hBS11 cells before (open circles), during the treatment of atropine (red circles), and after washing off atropine (blue circles) are shown. (b) Pooled data regarding the effect of atropine on carbachol-induced intracellular Ca2+ elevation. Atropine treatment significantly blocked the Ca2+ elevation. Statistical significance (p-value) was estimated using the multi-comparison Dunnett’s test (n = 8). Each dashed line connecting open circles represents data obtained from the same cells. Each bar represents average and standard error of mean. (D) hBS11 cells were cultured for 14 days in pmDM and preloaded with Fluo-4 AM. Next, the medium was switched to a calcium-deleted Krebs-Ringer solution supplemented with 90 mM KCl. The cells were sequentially observed using epifluorescence microscopy and time-lapse recordings with a 30-second interval. Incubation time before and after stimulation with calcium (2.8 mM) is shown at the upper panel corners. Scale bar, 10 μm.
Fig 5
Fig 5. Recordings of voltage-dependent sodium currents during depolarization in immortalized human bladder smooth muscle cells.
(A) Voltage-activated sodium currents were recorded by from −80 mV to −40, −20, 0, and 20 mV. (B) Voltage–current relationship of voltage-activated sodium currents in differentiated hBS11 cells (n = 10). Each point represents mean ± standard error of mean. (C) Effect of tetrodotoxin (TTX) on sodium currents. Representative traces of inward currents were elicited by depolarization to 0 mV in hBS11 cells before (black line) and during (red line) TTX treatment and after washing off TTX (blue line). Washing off TTX after 5 min partially recovered the amplitude of inward currents. (D) Summary data for the inhibitory action of TTX on sodium currents. Each dashed line connecting open circles represents data obtained from the same cells. Each bar represents average and standard error of mean.
Fig 6
Fig 6. A23187-induced contraction of immortalized human bladder smooth muscle cells.
(A) hBS11 cells were preloaded with SiR-actin (100 nM) for 2 h on day 3 or 9 of differentiation culture and then cultured for another 3 days in pmDM. Next, the cells were treated with a calcium ionophore A23187 (5 μM) on day 6 (upper row) or 12 (lower row) of differentiated culture. The cells were sequentially observed using epifluorescence microscopy and time-lapse recordings at 5 s intervals. Small arrows represent contracted actin bundles. Incubation time before and after stimulation with A23187 is shown at the upper panel corners. Scale bar, 10 μm. (B) Cells were cultured in pmDM for 12 days and stimulated with (f-j) or without (a-e) A23187 (5 μM) for 10 min. Next, the cells were subjected to filamentous actin staining with Alexa 546-conjugated phalloidin (red in b, d, g and i) and immunostaining analysis with antibodies for α-SMA (green). Images of the same fields are shown in a-c, d-e, f-h and i-j, respectively. Arrow heads represent thickened knob-like actin bundles. Nuclei were stained with DAPI (blue). Scale bars, 100 μm for (a-c and f-h) and 20 μm for (d,e,i and j). (C) hBS11 cells were cultured in pmDM for 7 days and stimulated with A23187 (5 μM) for 45 min. Next, the cells were subjected to immunostaining analysis with antibodies for α-SMA (green) and β-CYA (red). The phase contrast image (a) and merged image (b) of c and d are shown. The cells that were intensely stained with α-SMA antibody (arrow heads) exclusively shrank. In contrast, the intact spreading cells (arrows) contained β-CYA-positive and α-SMA-negative bundles. Scale bar, 100 μm.
Fig 7
Fig 7. Retrograde differentiation of differentiated immortalized human bladder smooth muscle cells.
(A) hBS11 cells were cultured in pmDM for 10 days and then re-fed with pmGM. The cells were sequentially observed using phase contrast microscopy and time-lapse recordings with a 15-min interval. The time after medium switching to pmGM is shown in each image. Arrows represent a differentiated cell and its daughter cells. (B) hBS11 cells were cultured in pmDM for 19 days, and the medium was switched to fresh pmDM (a) or pmGM (b-f). Next, the cells were cultured for another 28 h and subjected to immunostaining analysis with an antibody for α-SMA (red). Panels with high magnification (c-f) show anaphase (c and d) and metaphase (e and f) cells in the re-feeding culture using epifluorescence (d and f) and phase contrast (c and e) microscopy. Asterisks represent telophase chromosomes. Arrows represent metaphase chromosomes. Nuclei were stained with DAPI (blue). Scale bar, 100 μm (a and b), 25 μm (c-f). (C) hBS11 cells were cultured in pmDM for 12 days. The medium was switched to pmDM (DM) or pmGM (GM) and cultured for another 24 h. The cells were labeled with EdU during the last 4 h of culture. EdU-positive nuclei were detected in three independent cultures. The average and standard deviation are analyzed using Student’s t-test. The p-value was less than 0.01. (D) Cells were cultured in pmDM for 10 days, and the medium was switched to pmDM (a-c) or pmGM (d-f). Next, the cells were cultured for 3 days and subjected to filamentous actin staining with Alexa 546-conjugated phalloidin (PhaL; red) and immunostaining analysis with antibodies for α-SMA (green). Nuclei were stained with DAPI (blue).
Fig 8
Fig 8. Phenotypic modulation of human bladder smooth muscle cells.
(A) Structural changes of a bladder between contraction for expelling and expansion for storage of urine. Arrows represent the direction of intraluminal pressure. (B) A schematic figure for bidirectional phenotypic modulation of human bladder smooth muscle cells. Detailed explanations and discussion for reversible differentiation and isoform-dependent reorganization of actin bundles are outlined in the main text. (C) A schematic figure for the phenotypic modulation of vascular smooth muscle cells. Dedifferentiated SMC is a collective term of a variety of SMC subtypes. Dedifferentiation from contractile phenotype to synthetic phenotype is often irreversible or partially reversible.

References

    1. Campbell JH, Campbell GR. Smooth muscle phenotypic modulation—a personal experience. Arteriosclerosis, thrombosis, and vascular biology. 2012;32(8):1784–9. doi: 10.1161/ATVBAHA.111.243212 . - DOI - PubMed
    1. Halayko AJ, Solway J. Molecular mechanisms of phenotypic plasticity in smooth muscle cells. Journal of applied physiology. 2001;90(1):358–68. . - PubMed
    1. Rensen SS, Doevendans PA, van Eys GJ. Regulation and characteristics of vascular smooth muscle cell phenotypic diversity. Netherlands heart journal: monthly journal of the Netherlands Society of Cardiology and the Netherlands Heart Foundation. 2007;15(3):100–8. doi: 10.1007/BF03085963 - DOI - PMC - PubMed
    1. Owens GK, Kumar MS, Wamhoff BR. Molecular regulation of vascular smooth muscle cell differentiation in development and disease. Physiol Rev. 2004;84(3):767–801. doi: 10.1152/physrev.00041.2003 . - DOI - PubMed
    1. Xie C, Ritchie RP, Huang H, Zhang J, Chen YE. Smooth muscle cell differentiation in vitro: models and underlying molecular mechanisms. Arteriosclerosis, thrombosis, and vascular biology. 2011;31(7):1485–94. doi: 10.1161/ATVBAHA.110.221101 - DOI - PMC - PubMed

LinkOut - more resources