

Association of Socioeconomics With Prevalence of Visual Impairment and Blindness
- PMID: 29049446
- PMCID: PMC6583541
- DOI: 10.1001/jamaophthalmol.2017.3449
Association of Socioeconomics With Prevalence of Visual Impairment and Blindness
Abstract
Importance: Vision loss is the third most common impairment worldwide. Although cost-effective interventions are available for preventing or curing most causes of vision loss, availability of these interventions varies considerably between countries and districts. Knowledge of the association between vision loss and socioeconomic factors is informative for public health planning.
Objectives: To explore correlations of the prevalence of visual impairment with socioeconomic factors at country levels and to model and estimate a socioeconomic-adjusted disease burden based on these data.
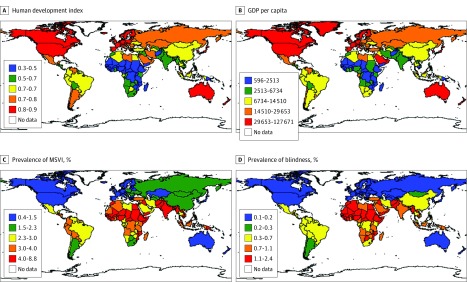
Design, setting, and participants: In this cross-sectional study, the following data were collected from 190 countries and territories: the age-standardized prevalence of moderate to severe visual impairment (MSVI) and blindness from January 1 to December 31, 2010, across countries, human development index (HDI), gross domestic product (GDP) per capita, total health expenditure, total health expenditure as percentage of GDP (total health expenditure/GDP), public health expenditure as percentage of total health expenditure (public/total health expenditure), and out-of-pocket expenditure as percentage of total health expenditure (out-of-pocket/total health expenditure). Countries were divided into 4 levels (low, medium, high, and very high) by HDI. Data analysis was conducted from September 1, 2016, to July 1, 2017.
Main outcomes and measures: The correlations between prevalence data and socioeconomic indices were assessed.
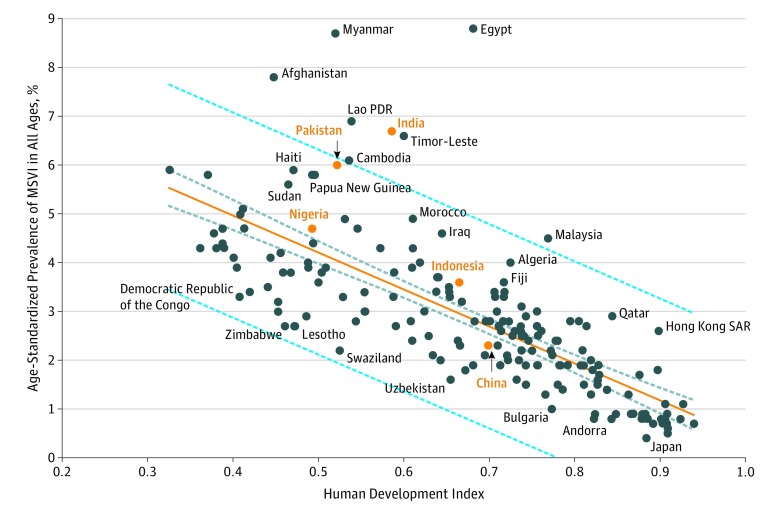
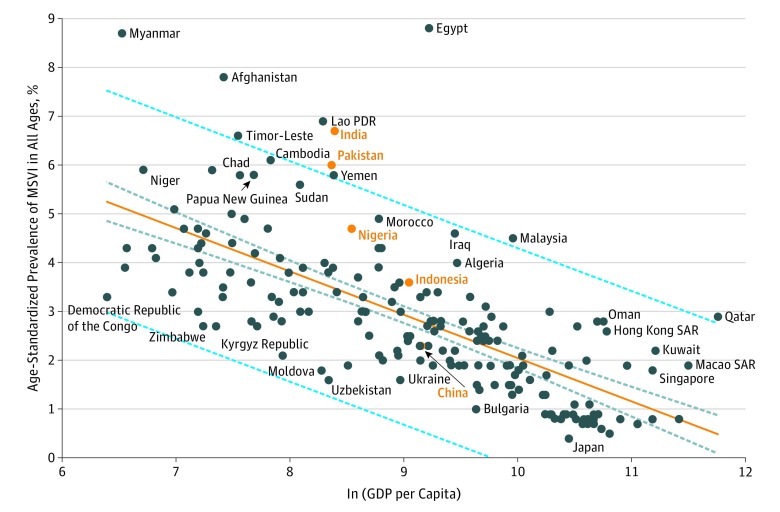
Results: A strong negative association between prevalence rates of MSVI and blindness and socioeconomic level of development was observed. The mean (SD) age-standardized prevalence of MSVI decreased from 4.38% (1.32%) in low-HDI regions to 1.51% (1.00%) in very-high-HDI regions (P < .001). The national HDI level was attributable to 56.3% of global variation in prevalence rates of MSVI and 67.1% of global variation in prevalence rates of blindness. Higher prevalence rates were also associated with lower total health expenditure per capita, total health expenditure/GDP (β = −0.236 [95% CI, −0.315 to −0.157] for prevalence of MSVI; β = −0.071 [95% CI, −0.100 to −0.042] for prevalence of blindness), public/total health expenditure (β = −0.041 [95% CI, −0.052 to −0.031] for prevalence of MSVI; β = −0.014 [95% CI, −0.018 to −0.010] for prevalence of blindness), and higher percentage of out-of-pocket/total health expenditure (β = 0.044 [95% CI, 0.032-0.055] for prevalence of MSVI; β = 0.013 [95% CI, 0.009-0.017] for prevalence of blindness). Countries with increased burden of visual impairment and blindness can be easily identified by the results of the linear models. Socioeconomic factors could explain 69.4% of the global variations in prevalence of MSVI and 76.3% of the global variations in prevalence of blindness.
Conclusions and relevance: Burden of visual impairment and socioeconomic indicators were closely associated and may help to identify countries requiring greater attention to these issues. The regression modeling described may provide an opportunity to estimate appropriate public health targets that are consistent with a country’s level of socioeconomic development.
Conflict of interest statement
Figures
References
-
- GBD 2015 Disease and Injury Incidence and Prevalence Collaborators Global, regional, and national incidence, prevalence, and years lived with disability for 310 diseases and injuries, 1990-2015: a systematic analysis for the Global Burden of Disease Study 2015. Lancet. 2016;388(10053):1545-1602. - PMC - PubMed
-
- Stevens GA, White RA, Flaxman SR, et al. ; Vision Loss Expert Group . Global prevalence of vision impairment and blindness: magnitude and temporal trends, 1990-2010. Ophthalmology. 2013;120(12):2377-2384. - PubMed
-
- Pascolini D, Mariotti SP. Global estimates of visual impairment: 2010. Br J Ophthalmol. 2012;96(5):614-618. - PubMed
-
- Verguet S, Alkire BC, Bickler SW, et al. . Timing and cost of scaling up surgical services in low-income and middle-income countries from 2012 to 2030: a modelling study. Lancet Glob Health. 2015;3(suppl 2):S28-S37. - PubMed
Publication types
MeSH terms
LinkOut - more resources
Full Text Sources
Other Literature Sources
