

Review
doi: 10.1021/acs.analchem.7b04202.
Epub 2017 Oct 31.
Recent Advances in the Mass Spectrometry Methods for Glycomics and Cancer
Affiliations
- PMID: 29049885
- PMCID: PMC6200424
- DOI: 10.1021/acs.analchem.7b04202
Item in Clipboard
Review
Recent Advances in the Mass Spectrometry Methods for Glycomics and Cancer
Anal Chem.
.
Abstract
Figures

Representation of the glycosylation pathway of proteins. The pathway illustrates the complexity and heterogeneity of structures. The proteins may exit the pathway with various levels of glycosylation.
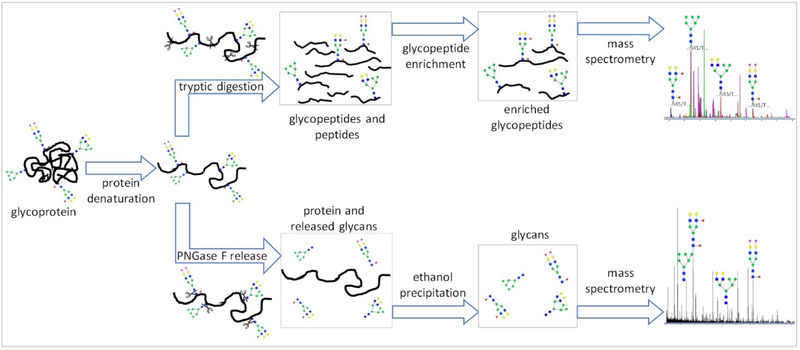
Workflow scheme of glycan analysis in protein: Released glycan analysis by LC-MS and glycopeptide analysis by LC-MS/MS

Strategies for glycan release from glycoproteins and glycosphingolipids: oxidative release of natural glycans (ORNG) vs. traditional glycomics methods. Reprinted with permission from Song, X.; Ju, H.; Lasanajak, Y.; Kudelka, M. R.; Smith, D. F.; Cummings, R. D., Oxidative release of natural glycans for functional glycomics. Nat Meth
2016,
13 (6), 528–534 ref(27). (Permission pending). Copyright 2016 Nature.

MALDI-MS imaging of glycans on a liver tissue microarray with tumor (T) and normal (N) tissue cores from 16 hepatocellular carcinoma patients. The map corresponds to putative glycan structures (inset). Reprinted from Powers, T.; Holst, S.; Wuhrer, M.; Mehta, A.; Drake, R., Two-Dimensional N-Glycan Distribution Mapping of Hepatocellular Carcinoma Tissues by MALDI-Imaging Mass Spectrometry. Biomolecules
2015,
5 (4), 2554 (ref 42). Under Creative Commons license (CC BY 4.0) (http://creativecommons.org/licenses/by/4.0/ ).

N-Glycan profile with LC-MS from a sample containing cell membranes combined from three cell lines including Caco-2, HT-29, HCC1954. Over 800 compounds are observed in a single the LC-MS run.

N-Glycan profile of serum glycans with LC- QTOF MS. Peaks are numbered according to their abundances and correspond to individual annotated structures. Reprinted from Song, T.; Aldredge, D.; Lebrilla, C. B., A Method for In-Depth Structural Annotation of Human Serum Glycans That Yields Biological Variations. Anal Chem
2015,
87 (15), 7754–62 ref (32). Copyright 2015 American Chemical Society.

Tandem MS of glycopeptides: (a) neutral glycopeptides, (b) sialylated glycopeptides, and (c) high mannose glycopeptides. Reprinted from Hong, Q.; Ruhaak, L. R.; Stroble, C.; Parker, E.; Huang, J.; Maverakis, E.; Lebrilla, C. B., A Method for Comprehensive Glycosite-Mapping and Direct Quantitation of Serum Glycoproteins. J Proteome Res
2015,
14 (12), 5179–92 ref (99). Copyright 2015 American Chemical Society.
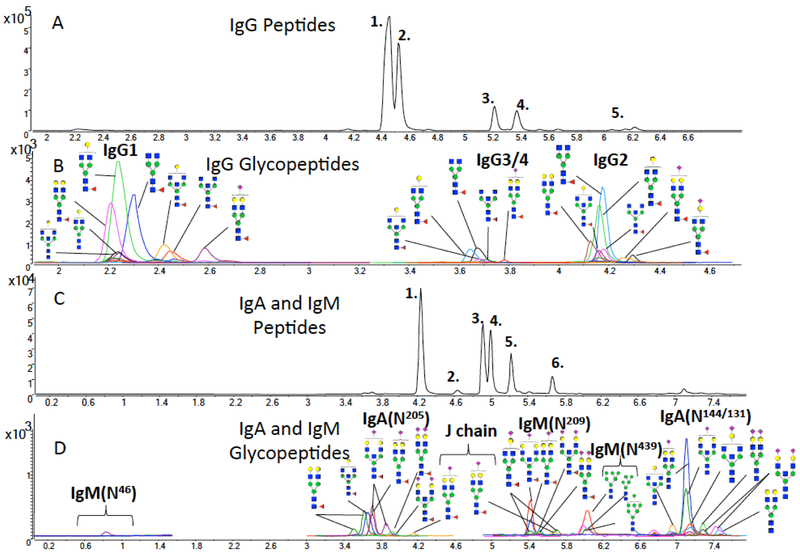
MRM of peptides and glycopeptides of immunoglobulins in serum. The spectra were extracted from a single LC-MS run with a total time of 10 minutes. Reprinted from Hong, Q.; Ruhaak, L. R.; Stroble, C.; Parker, E.; Huang, J.; Maverakis, E.; Lebrilla, C. B., A Method for Comprehensive Glycosite-Mapping and Direct Quantitation of Serum Glycoproteins. J Proteome Res
2015,
14 (12), 5179–92 ref (99). Copyright 2015 American Chemical Society.

Schematic representation of glycosphingolipid (GSL) root structures found in mammalian systems, and structures of some GSLs of interest discussed in the text.
References
-
- Sethi MK; Kim H; Park CK; Baker MS; Paik YK; Packer NH; Hancock WS; Fanayan S; Thaysen-Andersen M, In-depth N-glycome profiling of paired colorectal cancer and non-tumorigenic tissues reveals cancer-, stage- and EGFR-specific protein N-glycosylation. Glycobiology 2015, 25 (10), 1064–78. - PubMed
-
- Holst S; Wuhrer M; Rombouts Y, Glycosylation characteristics of colorectal cancer. Adv Cancer Res 2015, 126, 203–56. - PubMed
-
- Meezan E; Wu HC; Black PH; Robbins PW, Comparative studies on the carbohydrate-containing membrane components of normal and virus-transformed mouse fibroblasts. II. Separation of glycoproteins and glycopeptides by sephadex chromatography. Biochemistry 1969, 8 (6), 2518–2524. - PubMed
Publication types
MeSH terms
Substances
Grants and funding
LinkOut - more resources
Full Text Sources
Other Literature Sources
