

Alcohol expectancies longitudinally predict drinking and the alcohol myopia effects of relief, self-inflation, and excess
- PMID: 29049894
- PMCID: PMC5701836
- DOI: 10.1016/j.addbeh.2017.10.006
Alcohol expectancies longitudinally predict drinking and the alcohol myopia effects of relief, self-inflation, and excess
Abstract
Introduction: Alcohol myopia theory posits that alcohol consumption attenuates information processing capacity, and that expectancy beliefs together with intake level are responsible for experiences in myopic effects (relief, self-inflation, and excess).
Methods: Adults (N=413) averaging 36.39 (SD=13.02) years of age completed the Comprehensive Effects of Alcohol questionnaire at baseline, followed by alcohol use measures (frequency and quantity) and the Alcohol Myopia Scale one month later. Three structural equation models based on differing construct manifestations of alcohol expectancies served to longitudinally forecast alcohol use and myopia.
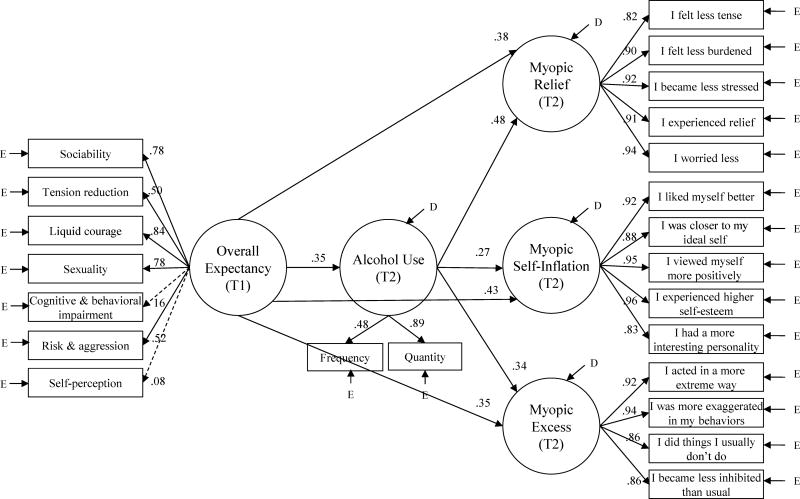
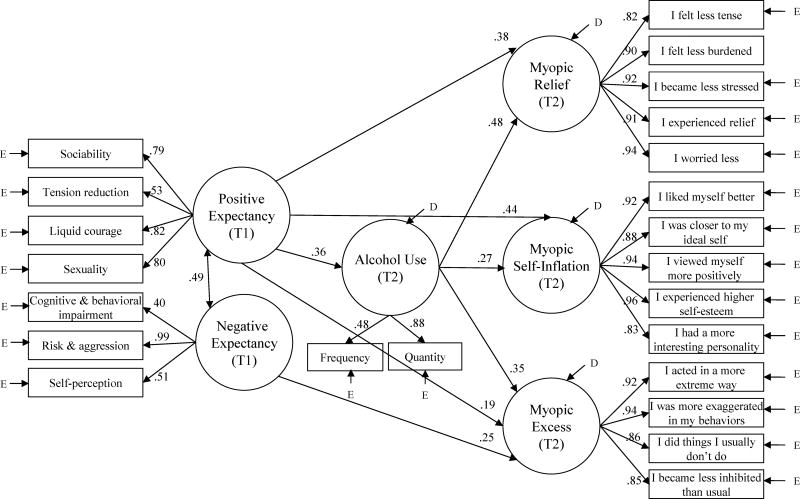
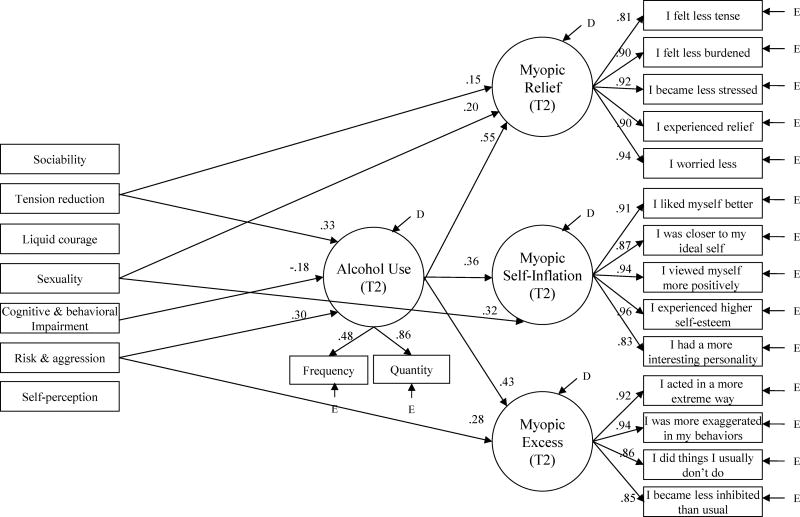
Results: In Model 1, overall expectancy predicted greater alcohol use and higher levels of all three myopic effects. In Model 2, specifying separate positive and negative expectancy factors, positive but not negative expectancy predicted greater use. Furthermore, positive expectancy and use explained higher myopic relief and higher self-inflation, whereas positive expectancy, negative expectancy, and use explained higher myopic excess. In Model 3, the seven specific expectancy subscales (sociability, tension reduction, liquid courage, sexuality, cognitive and behavioral impairment, risk and aggression, and self-perception) were simultaneously specified as predictors. Tension reduction expectancy, sexuality expectancy, and use contributed to higher myopic relief; sexuality expectancy and use explained higher myopic self-inflation; and risk and aggression expectancy and use accounted for higher myopic excess. Across all three predictive models, the total variance explained ranged from 12 to 19% for alcohol use, 50 to 51% for relief, 29 to 34% for self-inflation, and 32 to 35% for excess.
Conclusions: Findings support that the type of alcohol myopia experienced is a concurrent function of self-fulfilling alcohol prophecies and drinking levels. The interpreted measurement manifestation of expectancy yielded different prevention implications.
Keywords: Alcohol; Alcohol expectancies; Alcohol myopia; Longitudinal; Mediation.
Copyright © 2017 Elsevier Ltd. All rights reserved.
Conflict of interest statement
There are no conflicts of interest to declare.
Figures
References
-
- Anderson JC, Gerbing DW. Structural equation modeling in practice: A review and recommended two-step approach. Psychological Bulletin. 1988;103:411–423.
-
- Baker TB, Piper ME, McCarthy DE, Majeskie MR, Fiore MC. Addiction motivation reformulated: an affective processing model of negative reinforcement. Psychological Review. 2004;111:33. - PubMed
-
- Balogun O, Koyanagi A, Stickley A, Gilmour S, Shibuya K. Alcohol consumption and psychological distress in adolescents: A multi-country study. Journal of Adolescent Health. 2014;54:228–234. - PubMed
-
- Banaji MR, Steele CM. Alcohol and self-evaluation: Is a social cognition approach beneficial? Social Cognition. 1989;7:137–151.
MeSH terms
Grants and funding
LinkOut - more resources
Full Text Sources
Other Literature Sources
Medical
