. 2017 Aug 10;8(41):69237-69249.
doi: 10.18632/oncotarget.20144. eCollection 2017 Sep 19.

Targeting MUC1-C suppresses polycomb repressive complex 1 in multiple myeloma

Affiliations

Targeting MUC1-C suppresses polycomb repressive complex 1 in multiple myeloma

Ashujit Tagde et al. Oncotarget. .

Abstract

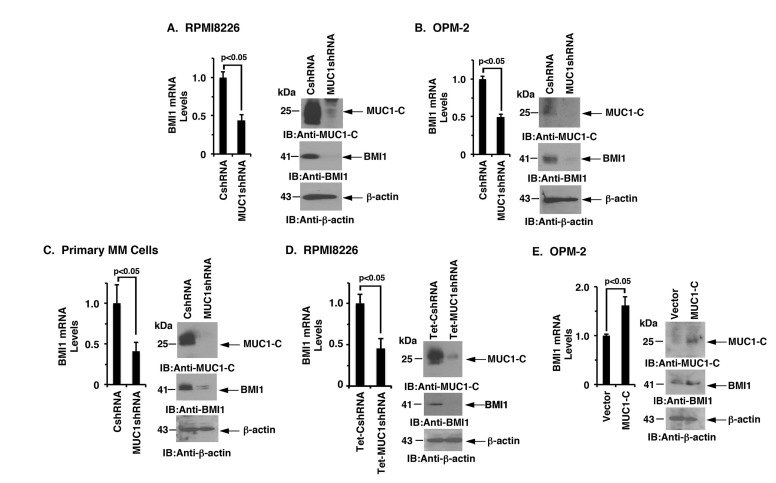
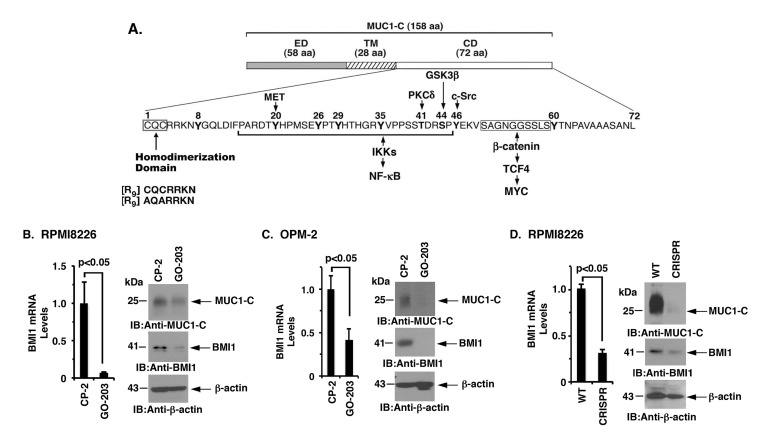
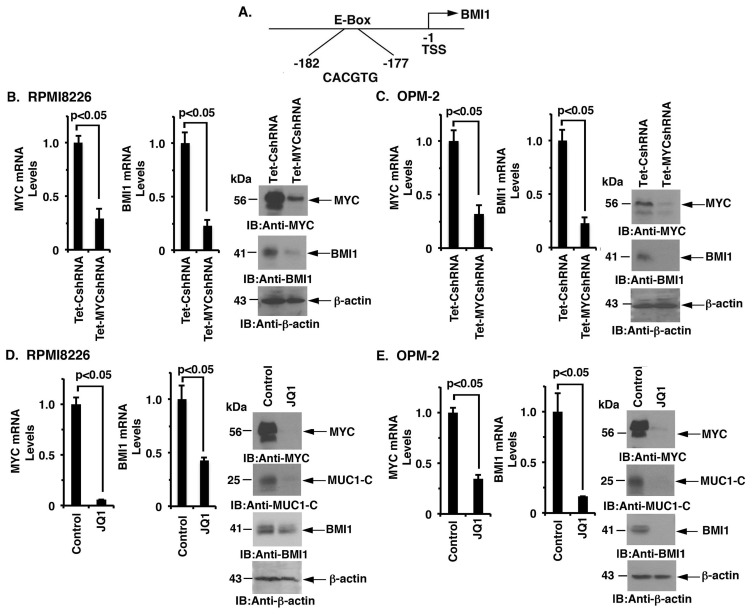
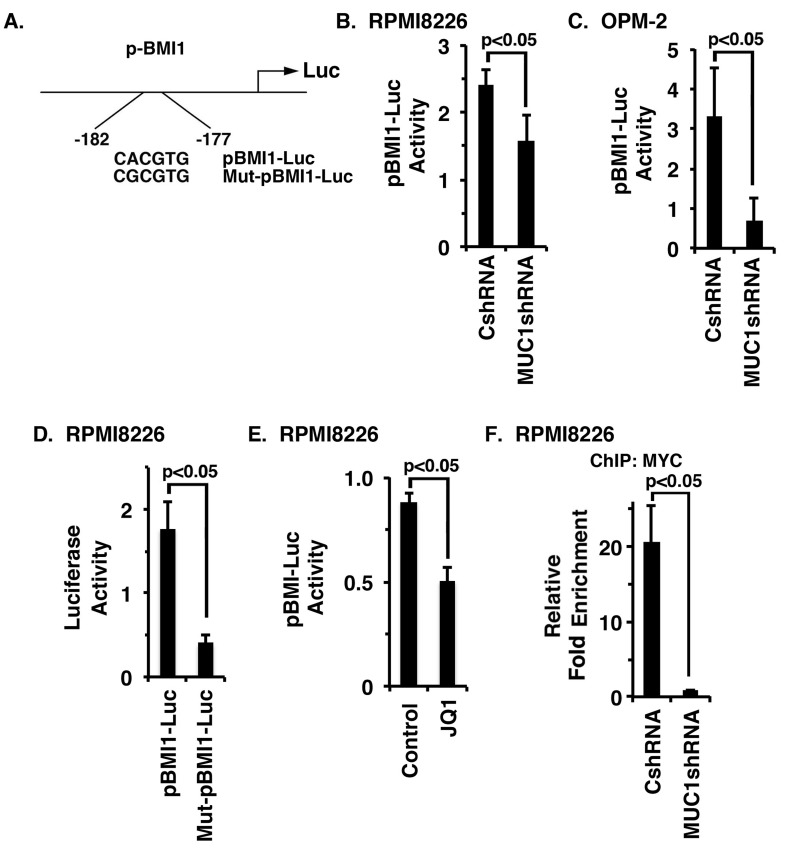
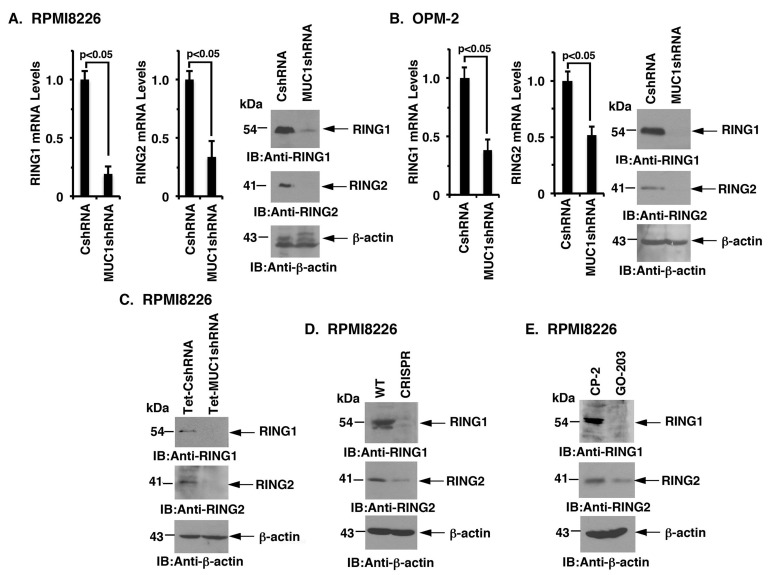
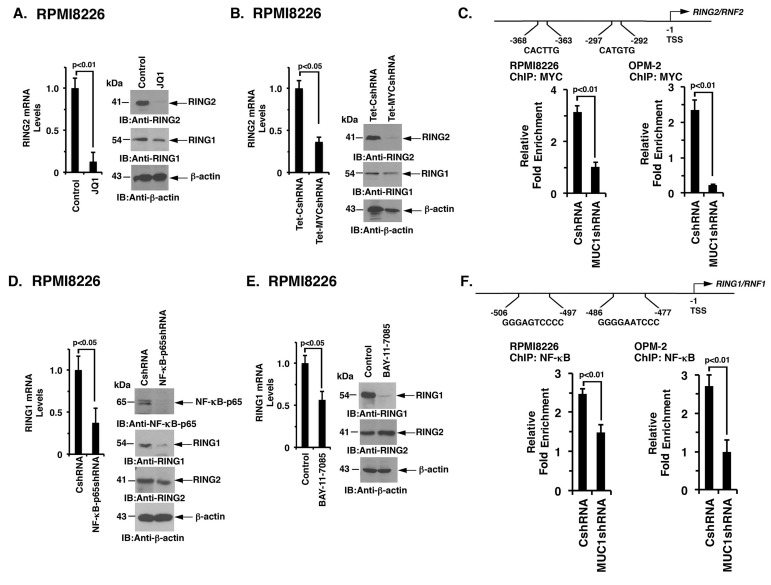
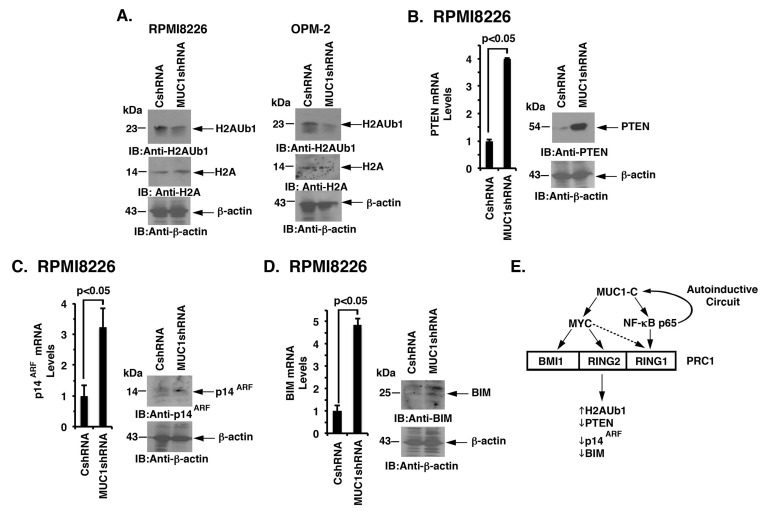
The polycomb repressive complex 1 (PRC1) includes the BMI1, RING1 and RING2 proteins. BMI1 is required for survival of multiple myeloma (MM) cells. The MUC1-C oncoprotein is aberrantly expressed by MM cells, activates MYC and is also necessary for MM cell survival. The present studies show that targeting MUC1-C with (i) stable and inducible silencing and CRISPR/Cas9 editing and (ii) the pharmacologic inhibitor GO-203, which blocks MUC1-C function, downregulates BMI1, RING1 and RING2 expression. The results demonstrate that MUC1-C drives BMI1 transcription by a MYC-dependent mechanism. MUC1-C thus promotes MYC occupancy on the BMI1 promoter and thereby activates BMI1 expression. We also show that the MUC1-C→MYC pathway induces RING2 expression. Moreover, in contrast to BMI1 and RING2, we found that MUC1-C drives RING1 by an NF-κB p65-dependent mechanism. Targeting MUC1-C and thereby the suppression of these key PRC1 proteins was associated with downregulation of the PRC1 E3 ligase activity as evidenced by decreases in ubiquitylation of histone H2A. Targeting MUC1-C also resulted in activation of the PRC1-repressed tumor suppressor genes, PTEN, CDNK2A and BIM. These findings identify a heretofore unrecognized role for MUC1-C in the epigenetic regulation of MM cells.

Keywords: BMI1; MUC1-C; RING1; RING2; multiple myeloma.


Conflict of interest statement

CONFLICTS OF INTEREST DK has ownership interest (including patents) and is a consultant/advisory board member of Genus Oncology. No potential conflicts of interest were disclosed by the other authors.

Figures

Figure 1
Figure 1. Targeting MUC1-C downregulates BMI1 expression
A.-C. RPMI8226 (A), OPM-2 (B), and primary MM (C) cells from Patient #1 stably expressing a control shRNA (CshRNA) or a MUC1 shRNA were analyzed for BMI1 mRNA levels by qRT-PCR (left). The results (mean±SD of 3 determinations) are expressed as relative mRNA levels as compared with that obtained for the CshRNA cells (assigned a value of 1). Lysates were immunoblotted with the indicated antibodies (right). D. RPMI8226 cells were stably transduced to express a Tetracycline-inducible control shRNA (Tet-CshRNA) or a MUC1shRNA (Tet-MUC1shRNA). Cells treated with 200 ng/ml DOX for 5 d were analyzed for BMI1 mRNA levels by qRT-PCR (left). The results (mean±SD of 3 determinations) are expressed as relative mRNA levels compared with that obtained for control DOX-treated Tet-CshRNA cells (assigned a value of 1). Lysates were immunoblotted with the indicated antibodies (right). E. OPM-2 cells transiently transduced to express an empty vector or one expressing MUC1-C were analyzed for BMI1 mRNA levels by qRT-PCR (left). The results (mean±SD of 3 determinations) are expressed as relative mRNA levels as compared with that obtained for the vector cells (assigned a value of 1). Lysates from were immunoblotted with the indicated antibodies (right).
Figure 2
Figure 2. Targeting the MUC1-C cytoplasmic domain downregulates BMI1 expression
A. Schema of the MUC1-C subunit with the 58-aa extracellular domain (ED), the 28-aa transmembrane domain (TM) and the 72-aa cytoplasmic domain (CD). Highlighted is the CQC motif, which is necessary and sufficient for MUC1-C homodimerization, and is targeted by GO-203 and not the control peptide CP-2. Also highlighted are interactions of the MUC1-C cytoplasmic domain with effectors of the NF-κB and MYC pathways. B.-C. RPMI8226 (B) and OPM-2 (C) cells were treated with 5 μM CP-2 or GO-203 for 48 h. The cells were analyzed for BMI1 mRNA levels by qRT-PCR (left). The results (mean±SD of 3 determinations) are expressed as relative mRNA levels as compared with that obtained for the CP-2-treated cells (assigned a value of 1). Lysates were immunoblotted with the indicated antibodies (right). D. RPMI8226 cells were silenced for MUC1 using CRISPR/Cas9 gene editing. The parental WT and CRISPR cells were analyzed for BMI1 mRNA levels by qRT-PCR (left). The results (mean±SD of 3 determinations) are expressed as relative mRNA levels as compared with that obtained for the WT cells (assigned a value of 1). Lysates were immunoblotted with the indicated antibodies (right).
Figure 3
Figure 3. MUC1-C regulates BMI1 expression by a MYC-dependent mechanism
A. Schema of the BMI1 promoter with highlighting of a MYC binding site (CACGTG) at positions -177 to -182. B.-C. RPMI8226/Tet-CshRNA and RPMI8226/Tet-MYCshRNA (B) and OPM-2/Tet-CshRNA and OPM-2/Tet-MYCshRNA (C) cells treated with DOX for 5 d were analyzed for MYC and BMI1 mRNA levels by qRT-PCR (left and middle). The results (mean±SD of 3 determinations) are expressed as relative mRNA levels compared with that obtained for the Tet-CshRNA cells (assigned a value of 1). Lysates were immunoblotted with the indicated antibodies (right). D.-E. RPMI8226 (D) and OPM-2 (E) cells treated with JQ1 or vehicle control for 48 h were analyzed for MYC and BMI1 mRNA levels by qRT-PCR (left and middle). The results (mean±SD of 3 determinations) are expressed as relative mRNA levels compared with that obtained for the control cells (assigned a value of 1). Lysates were immunoblotted with the indicated antibodies (right).
Figure 4
Figure 4. MUC1-C activates BMI1 gene transcription by a MYC-dependent mechanism
A. Schema of the pBMI1-Luc reporter with highlighting of the wild-type (WT) and mutated MYC binding site. B.-C. The designated RPMI8226 (B) and OPM-2 (C) cells expressing a CshRNA or MUC1shRNA were transfected with pGL3-Luc or pBMI1-Luc and SV40-Renilla-Luc as an internal control. Luciferase activity was measured at 24 h after transfection. The results (mean±SE of 3 determinations) are expressed as the relative luciferase activity compared with that obtained with cells expressing pGL3-Luc. D. RPMI8226 cells were transfected with (i) pGL3-Luc, (ii) pBMI1-Luc or Mut-pBMI1-Luc and (iii) SV40-Renilla-Luc. Luciferase activity was measured at 24 h after transfection. The results (mean±SE of 3 determinations) are expressed as the relative luciferase activity compared with that obtained with cells expressing pGL3-Luc. E. RPMI8226 cells were treated with JQ1 or vehicle control for 48 h and then transfected with the pGL3-Luc or pBMI1-Luc and SV-40-Renilla-Luc. Luciferase activity was measured at 24 h after transfection. The results (mean±SE of 3 determinations) are expressed as the relative luciferase activity compared with that obtained with cells expressing pGL3-Luc. F. Soluble chromatin from the RPMI8226/CshRNA and RPMI8226/MUC1shRNA cells was precipitated with anti-MYC or a control IgG antibody. The final DNA samples were amplified by qPCR with pairs of primers (Supplementary Table 2) for the MYC binding site in the BMI1 promoter. The results (mean±SE of 3 determinations) are expressed as the relative fold enrichment compared with that obtained for the IgG control (assigned a value of 1).
Figure 5
Figure 5. Targeting MUC1-C downregulates RING1 and RING2 expression
A.-B. The designated RPMI8226 (A) and OPM-2 (B) cells expressing a CshRNA or MUC1shRNA were analyzed for RING1 and RING2 mRNA levels by qRT-PCR (left and middle). The results (mean±SD of 3 determinations) are expressed as relative mRNA levels as compared with that obtained for the CshRNA cells (assigned a value of 1). Lysates were immunoblotted with the indicated antibodies (right). C.-E. Lysates from DOX-treated RPMI8226/Tet-CshRNA and RPMI8226/Tet-MUC1shRNA (C), RPMI8226/WT and RPMI8226/CRISPR (D), and CP-2- and GO-203-treated RPMI8226 cells (E) were immunoblotted with the indicated antibodies.
Figure 6
Figure 6. MUC1-C regulates RING2 and RING1 by MYC- and NF-κB p65-dependent mechanisms, respectively
A. RPMI8226 cells treated with JQ1 or vehicle control for 48 h were analyzed for RING2 mRNA levels by qRT-PCR (left). The results (mean±SD of 3 determinations) are expressed as relative mRNA levels as compared with that obtained for the vehicle treated cells (assigned a value of 1, left). Lysates were immunoblotted with the indicated antibodies (right). B. RPMI8226/Tet-CshRNA and RPMI8226/Tet-MYCshRNA cells treated with DOX for 5 d were analyzed for RING2 mRNA levels by qRT-PCR (left). The results (mean±SD of 3 determinations) are expressed as relative mRNA levels as compared with that obtained for the Tet-CshRNA cells (assigned a value of 1). Lysates were immunoblotted with the indicated antibodies (right). C. Schema of the RING2 promoter with highlighting of putative MYC binding sites. Soluble chromatin from the RPMI8226/CshRNA and RPMI8226/MUC1shRNA (left) and OPM-2/CshRNA and OPM-2/MUC1shRNA (right) cells was precipitated with anti-MYC or a control IgG antibody. The final DNA samples were amplified by qPCR with pairs of primers (Supplementary Table S2) encompassing the MYC binding sites in the RING2 promoter. The results (mean±SE of 3 determinations) are expressed as the relative fold enrichment compared with that obtained for the IgG control (assigned a value of 1). D. RPMI8226/CshRNA and RPMI8226/NF-κBshRNA were analyzed for RING1 mRNA levels by qRT-PCR (left). The results (mean±SD of 3 determinations) are expressed as relative mRNA levels as compared with that obtained for the CshRNA cells (assigned a value of 1). Lysates were immunoblotted with the indicated antibodies (right). E. RPMI8226 cells treated with the 5 μM BAY-11-7085 or vehicle control for 24 h were assessed for RING1 levels by qRT-PCR (left). The results (mean±SD of 3 determinations) are expressed as relative mRNA levels as compared with that obtained for the vehicle treated cells (assigned a value of 1). Lysates were immunoblotted with the indicated antibodies (right). F. Schema of the RING1 promoter with highlighting of putative NF-κB p65 binding sites. Soluble chromatin from the RPMI8226/CshRNA and RPMI8226/MUC1shRNA (left) and OPM-2/CshRNA and OPM-2/MUC1shRNA (right) cells was precipitated with anti-NF-κB p65 or a control IgG antibody. The final DNA samples were amplified by qPCR with pairs of primers (Supplementary Table 2) encompassing the NF-κB p65 binding sites in the RING1 promoter. The results (mean±SE of 3 determinations) are expressed as the relative fold enrichment compared with that obtained for the IgG control (assigned a value of 1).
Figure 7
Figure 7. Targeting the MUC1-C → PRC1 pathway derepresses PTEN, p14ARF and BIM
A. Lysates from the designated RPMI8226 (left) and OPM-2 (right) cells expressing a CshRNA or MUC1shRNA were immunoblotted with the indicated antibodies. B.-D. RPMI8226/CshRNA and RPMI8226/MUC1shRNA cells were analyzed for PTEN (B), p14ARF (C) and BIM (D) mRNA levels by qRT-PCR (left). The results (mean±SD of 3 determinations) are expressed as relative mRNA levels as compared with that obtained for the CshRNA cells (assigned a value of 1). Lysates were immunoblotted with the indicated antibodies (right). E. Schema depicting the proposed involvement of MUC1-C in driving expression of the PRC1 components, BMI1, RING2 and RING1. MUC1-C activates the MYC gene in MM cells [8]. In turn, MYC occupies the BMI1 promoter by a MUC1-C-dependent mechanism and induces BMI1 expression. Targeting MUC1-C and thereby MYC also resulted in the downregulation of RING2, supporting a similar pathway for the regulation of BMI1 and RING2. MUC1-C binds directly to NF-κB p65 and promotes activation of NF-κB p65-target genes, including MUC1 itself in an autoinductive circuit [12]. Along these lines, targeting MUC1-C and NF-κB p65 resulted in the suppression of RING1 expression, indicating that MUC1-C regulates these three PRC1 components by a least two pathways. In contrast to BMI1 and RING2, targeting MYC was also associated with partial downregulation of RING1. In concert with the involvement of MUC1-C in regulating PRC1 components, the results further support a model in which MUC1-C activates PRC1 function and thereby the upregulation of H2AUb1 levels and suppression of PTEN, p14ARF and BIM expression in MM cells.

References

    1. Treon SP, Mollick JA, Urashima M, Teoh G, Chauhan D, Ogata A, Raje N, Hilgers JH, Nadler L, Belch AR, Pilarski LM, Anderson KC. Muc-1 core protein is expressed on multiple myeloma cells and is induced by dexamethasone. Blood. 1999;93:1287–98. - PubMed
    1. Paydas S, Sahin B, Gonlusen G, Hazar B, Zorludemir S. MUC1 expression in plasmacytoma. Leuk Res. 2001;25:221–5. - PubMed
    1. Cloosen S, Gratama J, van Leeuwen EB, Senden-Gijsbers BL, Oving EB, von Mensdorff-Pouilly S, Tarp MA, Mandel U, Clausen H, Germeraad WT, Bos GM. Cancer specific Mucin-1 glycoforms are expressed on multiple myeloma. Br J Haematol. 2006;135:513–6. doi: 10.1111/j.1365-2141.2006.06331.x. - DOI - PubMed
    1. Baldus SE, Palmen C, Thiele J. MUC1 (EMA) expressing plasma cells in bone marrow infiltrated by plasma cell myeloma. Histol Histopathol. 2007;22:889–93. doi: 10.14670/HH-22.889. - DOI - PubMed
    1. Kawano T, Ahmad R, Nogi H, Agata N, Anderson K, Kufe D. MUC1 oncoprotein promotes growth and survival of human multiple myeloma cells. Int J Oncology. 2008;33:153–9. - PMC - PubMed