. 2017 Dec;175(4):1543-1559.
doi: 10.1104/pp.17.00621. Epub 2017 Oct 19.

Mechanisms of Phosphorus Acquisition and Lipid Class Remodeling under P Limitation in a Marine Microalga

Affiliations

Mechanisms of Phosphorus Acquisition and Lipid Class Remodeling under P Limitation in a Marine Microalga

Alice Mühlroth et al. Plant Physiol. 2017 Dec.

Abstract

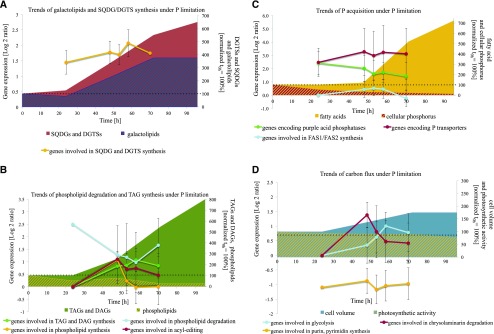
Molecular mechanisms of phosphorus (P) limitation are of great interest for understanding algal production in aquatic ecosystems. Previous studies point to P limitation-induced changes in lipid composition. As, in microalgae, the molecular mechanisms of this specific P stress adaptation remain unresolved, we reveal a detailed phospholipid-recycling scheme in Nannochloropsis oceanica and describe important P acquisition genes based on highly corresponding transcriptome and lipidome data. Initial responses to P limitation showed increased expression of genes involved in P uptake and an expansion of the P substrate spectrum based on purple acid phosphatases. Increase in P trafficking displayed a rearrangement between compartments by supplying P to the chloroplast and carbon to the cytosol for lipid synthesis. We propose a novel phospholipid-recycling scheme for algae that leads to the rapid reduction of phospholipids and synthesis of the P-free lipid classes. P mobilization through membrane lipid degradation is mediated mainly by two glycerophosphoryldiester phosphodiesterases and three patatin-like phospholipases A on the transcriptome level. To compensate for low phospholipids in exponential growth, N. oceanica synthesized sulfoquinovosyldiacylglycerol and diacylglyceroltrimethylhomoserine. In this study, it was shown that an N. oceanica strain has a unique repertoire of genes that facilitate P acquisition and the degradation of phospholipids compared with other stramenopiles. The novel phospholipid-recycling scheme opens new avenues for metabolic engineering of lipid composition in algae.


Figures

Figure 1.
Figure 1.
Growth and physiological parameters of N. oceanica in −P and +P cells. A, Time analysis of cell count of +P (black squares) and −P (black triangles) cells and dissolved Pi concentration in +P (white squares) and −P (white triangles) cultures. B, Photosynthetic activity (Fv/Fm) of +P (white squares) and −P (white triangles) cells and cellular P of +P (black squares) and −P (black triangles) cells as a function over time. Average values ± sd of three biological and two technical replicates from the first independent experiment are shown.
Figure 2.
Figure 2.
Transcriptional regulation of early responses and transporters under P limitation in N. oceanica. Regulation patterns (colored squares ranging from green to red) are derived from microarray data of putative genes encoding enzymes (black) that are involved in immediate responses to P limitation. All time points of the experiment are shown (24, 48, 53, 58, and 70 h). The scale at top represents gene expression ratio values, log2 transformed with P > 0.01 (nonsignificant regulation [diagonal line in a square]). No_ numbers indicate NannoCCMP1779 gene identifiers.
Figure 3.
Figure 3.
Lipid class content per cell as a function of time in N. oceanica of −P and +P cells. Lipid class classification is based on linear trap quadrupole identification and liquid chromatography-MS/MS by target lipid profiling. A, TAG. B, DGTS. C, DGDG. D, MGDG. E, SQDG. F, DAG. G, PC. H, PG. I, PE. J, PI. Asterisks denote significant (P < 0.05) phosphate effects in –P cells compared with +P cells at each time point. Average values ± se of three biological and two technical replicates from the first independent experiment are shown.
Figure 4.
Figure 4.
Model of the phospholipid-recycling scheme in N. oceanica under P limitation. The gene expression (colored squares) derived from microarray data of putative genes encoding for enzymes (italic red) involved in phospholipid degradation (A) and lipid biosynthesis (B) is shown at different experimental time points (24, 48, 53, 58, and 70 h). Nonsignificant regulation was considered at P > 0.01 (diagonal line in a square). Gene identifiers are shown without regulation pattern if they were not significantly differently regulated at any time point. The scale on the bottom right represents gene expression ratio values, log2 transformed. No_ numbers indicate NannoCCMP1779 gene identifiers. Some putative genes encoding enzymes involved in the presented pathways are not annotated in the genome or are unknown (red question marks). Multiple enzyme localizations (cytosolic, plastidial [green], endoplasmic reticulum [red]) are not considered; therefore, the prokaryotic pathway of DAG formation is not visualized. Lipids identified by lipidomics are framed. Enzyme abbreviations are as follows: ACS, acyl-CoA synthetase; BTA, S-adenosyl-Met (AdoMet); DAG, 3-amino-3-carboxypropyltransferase; CDGPT, CDP-diacylglycerol-glycerol 3-phosphatidyltransferase; CDIPT, CDP-diacylglycerol-inositol 3-phosphatidyltransferase; CDS, cytidine diphosphate (CDP)-diacylglycerol synthase; Cho, choline; CKI, choline kinase; CPT, cholinephosphotransferase; DGD, digalactosyl diacylglycerol synthase; DGAK, diacylglyceride kinase; DGAT, acyl-CoA:diacylglycerol acyltransferase; ECT, ethanolamine phosphate cytidylyltransferase; EKI, ethanolamine kinase; EPT, ethanolaminephosphotransferase; Etn, ethanolamine; ETNPPL, phosphoethanolamine phospholyase; GALE, UDP-Glc 4-epimerase; GDPD, glycerophosphoryldiester phosphodiesterase; GEP, phosphatidylglycerophosphatase; GLA, α-galactosidase; GPAT, acyl-CoA:glycerol-3-phosphate acyltransferase; GPDH, glycerol-3-phosphate dehydrogenase; IPCS, inositol phosphorylceramide synthase; LACS, long-chain acyl-CoA synthetase; LDSP, lipid droplet surface protein; LPAAT, acyl-CoA:lysophosphatidic acyltransferase; LPCAT, lysophosphatidylcholine acyltransferase; LPL, lysophospholipase; MGD, monogalactosyldiacylglycerol synthase; PAP, phosphatidic acid phosphatase; P-Cho, phosphocholine; PCT, choline phosphate cytidyltransferase; PDAT, phospholipid/diacylglycerol acyltransferase; PDCT, phosphocholine/diacylglycerol transferase; P-Etn, phosphoethanolamine; PLA, phospholipase A; PLC, phospholipase C; PLD, phospholipase D; PEAMT, phosphoethanolamine N-methyltransferase; PEM, phosphatidylethanolamine N-methyltransferase; PSD, phosphatidylserine decarboxylase; PSS, phosphatidylserine synthase; SQD1, UDP-sulfoquinovose synthase; SQT, sulfolipid sulfoquinovosyldiacylglycerol synthase; UGPase, UDP-Glc-pyrophosphorylase; UGP/PGM, UDP-Glc pyrophosphorylase/phosphoglucomutase. Compound abbreviations are as follows: G3P, glycerol-3-phosphate; G3PDE, glycerol-3-phosphodiester (glycerophosphocholine, glycerophosphoethanolamine, glycerophosphoglycerol, etc.); IPC, inositolphosphorylceramide; LPA, lysophosphatidic acid; LPC, lysophosphatidylcholine; DAG, diacylglyceride; DGDG, digalactosyldiacylglycerol; DGTS, diacylglyceroltrimethylhomoserine; MeCOH, acetaldehyde; MGDG, monogalactosyldiacylglycerol; PA, phosphatidic acid; PC, phosphatidylcholine; PE, phosphatidylethanolamine; PG, phosphatidylglycerol; PI, phosphatidylinositol; PS, phosphatidylserine; SQDG, sulfoquinovosyldiacylglycerol; TAG, triacylglyceride; UPD-Gal, UDP-galactose; UDP-SQ, UDP-sulfoquinovose.
Figure 5.
Figure 5.
Trends of cellular changes in −P cells of N. oceanica as a function of time. A, Changes of genes derived from microarray data involved in DGTS and SQDG synthesis (yellow line, one S-adenosyl-Met [AdoMet]:DAG 3-amino-3-carboxypropyltransferase [BTA], one UDP-sulfoquinovose synthase, one sulfolipid sulfoquinovosyldiacylglycerol synthase), shown with changes of galactolipid (blue striped area) and SQDG/DGTS change (red area) normalized to time point 0 h. B, Changes of TAGs and DAGs (green area), phospholipids (yellow striped area) normalized to time point 0 h, and the expression of genes involved in phospholipid degradation (blue line; three glycerophosphoryl diester phosphodiesterases, two patatin-like phospholipases A, four phospholipases A, two lysophospholipases), acyl editing (red line; one lysophosphatidylglycerol acyltransferase, one cholinephosphotransferase, one phospholipid/diacylglycerol acyltransferase, two phospholipases D), TAG and DAG biosynthesis (green line; two glycerol-3-phosphate acyltransferases, three lysophosphatidylglycerol acyltransferases, four phosphoesterase PA-phosphatases, eight diacylglycerol acyltransferases, one diacylglycerol kinase, one lipid droplet surface protein), and phospholipid biosynthesis (yellow line; one kinase, one ethanolamine phosphate cytidylyltransferase and phosphotransferase, one cholinephosphotransferase, one phosphoethanolamine N-methyltransferase, one CDP-diacylglycerol-inositol 3-phosphatidyltransferase). C, Changes of FA abundance (yellow area) and cellular P (red striped area) normalized to time point 0 h and of the expression of genes involved in P transporters (red line; five Pi transporters, two triose phosphate translocators, two vacuolar chaperone transporters), 10 purple acid phosphatases (green line), and FAS1/FAS2 synthesis (blue line; three acetyl-CoA carboxylases, two ketoacyl-synthases, three acyl-CoA synthetases, two long-chain acyl-synthetases, one thioesterase, two polyketide synthases type II, one peptide synthase, one hydroxyacyl-CoA synthase, six desaturases, two elongases). D, Changes of cell volume (blue area) and photosynthetic activity (yellow striped area) normalized to time point 0 h and the expression of genes involved in glycolysis (blue line; two Fru-2,6-bisphosphatases, two phosphoglycerate kinases, one glycerol-3-phosphate dehydrogenase, one dihydroxy-butanonkinase, one glyceraldehyde-3-phosphate dehydrogenase, four phosphoglycerate mutases, one enolase, three pyruvate kinases), chrysolaminarin degradation (red line; 11 endoglucanases, two exoglucanases), and purin, pyrimidine synthesis (yellow line). The presentation shows average log2 ratios of significantly expressed genes (P < 0.01) involved in metabolic clusters and changes of lipid classes (adjusted nmol 106 cells−1) or physiological parameters, such as cell volume (μm3) and FAs (pg cell−1) normalized to 0 h as 100%. For gene identifiers used for the calculation of average gene regulation and means, see Supplemental Excel Sheet S1. Average values ± se of the regulation of genes (P > 0.01 at each specific time point) involved in the specific pathway/catalysis are shown.

References

    1. Abdullahi AS, Underwood GJ, Gretz MR (2006) Extracellular matrix assembly in diatoms (Bacillariophyceae). J Phycol 42: 363–378
    1. Abida H, Dolch LJ, Meï C, Villanova V, Conte M, Block MA, Finazzi G, Bastien O, Tirichine L, Bowler C, et al. (2015) Membrane glycerolipid remodeling triggered by nitrogen and phosphorus starvation in Phaeodactylum tricornutum. Plant Physiol 167: 118–136 - PMC - PubMed
    1. Aksoy M, Pootakham W, Grossman AR (2014) Critical function of a Chlamydomonas reinhardtii putative polyphosphate polymerase subunit during nutrient deprivation. Plant Cell 26: 4214–4229 - PMC - PubMed
    1. Alboresi A, Perin G, Vitulo N, Diretto G, Block M, Jouhet J, Meneghesso A, Valle G, Giuliano G, Maréchal E, et al. (2016) Light remodels lipid biosynthesis in Nannochloropsis gaditana by modulating carbon partitioning between organelles. Plant Physiol 171: 2468–2482 - PMC - PubMed
    1. Bates PD, Browse J (2011) The pathway of triacylglycerol synthesis through phosphatidylcholine in Arabidopsis produces a bottleneck for the accumulation of unusual fatty acids in transgenic seeds. Plant J 68: 387–399 - PubMed