. 2018 Jan;103(1):40-50.
doi: 10.3324/haematol.2017.172775. Epub 2017 Oct 19.

Expansion of EPOR-negative macrophages besides erythroblasts by elevated EPOR signaling in erythrocytosis mouse models

Affiliations

Expansion of EPOR-negative macrophages besides erythroblasts by elevated EPOR signaling in erythrocytosis mouse models

Jieyu Wang et al. Haematologica. 2018 Jan.

Abstract

Activated erythropoietin (EPO) receptor (EPOR) signaling causes erythrocytosis. The important role of macrophages for the erythroid expansion and differentiation process has been reported, both in baseline and stress erythropoiesis. However, the significance of EPOR signaling for regulation of macrophages contributing to erythropoiesis has not been fully understood. Here we show that EPOR signaling activation quickly expands both erythrocytes and macrophages in vivo in mouse models of primary and secondary erythrocytosis. To mimic the chimeric condition and expansion of the disease clone in the polycythemia vera patients, we combined Cre-inducible Jak2V617F/+ allele with LysM-Cre allele which expresses in mature myeloid cells and some of the HSC/Ps (LysM-Cre;Jak2V617F/+ mice). We also generated inducible EPO-mediated secondary erythrocytosis models using Alb-Cre, Rosa26-loxP-stop-loxP-rtTA, and doxycycline inducible EPAS1-double point mutant (DPM) alleles (Alb-Cre;DPM mice). Both models developed a similar degree of erythrocytosis. Macrophages were also increased in both models without increase of major inflammatory cytokines and chemokines. EPO administration also quickly induced these macrophages in wild-type mice before observable erythrocytosis. These findings suggest that EPOR signaling activation could induce not only erythroid cell expansion, but also macrophages. Surprisingly, an in vivo genetic approach indicated that most of those macrophages do not express EPOR, but erythroid cells and macrophages contacted tightly with each other. Given the importance of the central macrophages as a niche for erythropoiesis, further elucidation of the EPOR signaling mediated-regulatory mechanisms underlying macrophage induction might reveal a potential therapeutic target for erythrocytosis.


Figures

Figure 1.
Figure 1.
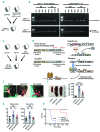
In vivo pathophysiological modeling of primary and secondary erythrocytosis. (A) Primary erythrocytosis model using LysM-Cre allele, and Cre-inducible Jak2V617F/+ knock-in allele. (B) PCR of DNA of sorted bone marrow (BM) or peripheral blood (PB) cells from Jak2V617F-mutant knock-in (KI) mice with or without LysM-Cre. (C and D) Inducible secondary erythrocytosis model using indicated alleles. Schematic for EPAS1 double point mutant (DPM) and doxycycline-inducible hepatocyte-specific induction of the DPM protein is shown in (D). (E) Appearance of hind paw of the indicated mice. (F) Spleen size in the indicated mice (n=8 each). (G) White blood cell (WBC) counts and platelet (Plts) counts in PB from the indicated mice at 2–3 months of age (Control: n=7; LysM-Cre;Jak2V617F mice; n=9) or 2 months after HIF-2α induction (n=9). Data are mean±Standard Deviation (s.d.). (H) Survival of LysM-Cre; Jak2V617F mice (n=9) and doxycycline-administrated Alb-Cre;DPM mice (n=9). *P<0.05; **P<0.01; ****P<0.0001; NS: not significant [one-way ANOVA with multiple comparisons correction (G) or two-way ANOVA with multiple comparisons correction (F), and log rank test (H)].
Figure 2.
Figure 2.
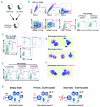
The novel mouse models LysM-Cre;Jak2V617F and Alb-Cre;DPM demonstrate a similar degree of erythrocytosis. (A and B) EPO mRNA expression in hepatocytes (A) and kidney (B) from indicated mice. Data are mean±Standard Deviation (s.d.) from duplicate samples. Results are representative of two independent experiments. (C) Serum erythropoietin (EPO) levels in the indicated mice (n=3–6 each). (D) Red blood cell (RBC) counts, hematocrit (Ht), and hemoglobin (Hb) counts in peripheral blood (PB) from the indicated mice at 2–3 months of age (Control, n=7; LysM-Cre;Jak2V617F mice, n=9) or two months after HIF-2α induction (n=9). Data are mean±Standard Deviation (s.d.). (E–H) Flow cytometric analysis of erythroid lineage cells in bone marrow (BM) and spleen (SP) from the indicated mice. Representative plots of erythropoiesis profiles (CD44 and FSC) in BM and SP CD45−, Ter119dim/+ population (E), and absolute number of erythroblasts (F) and each fraction of erythroblasts/mature erythroid cells in BM and SP (G and H) from indicated mice are shown (n=4 each). I (Pro): proerythroblasts; II (Baso): basophilic erythroblasts; III (Poly): polychromatic erythroblasts; IV (Ortho): orthochromatic erythroblasts; V (Retic): reticulocytes; VI (RBC): red blood cells. Data are mean±s.d. *P<0.05; **P<0.01; ***P<0.001; ****P<0.0001; NS: not significant (one-way ANOVA with multiple comparisons correction (D) or two-way ANOVA with multiple comparisons correction (F–H)).
Figure 3.
Figure 3.
Alteration of macrophage population in the erythrocytosis mice. (A and B) Flow cytometric analysis of bone marrow (BM)/spleen (SP) macrophage population in the indicated mice (n=5 each). The absolute number and frequency of total macrophages from the indicated mice are shown. Data are mean±Standard Deviation (s.d.). *P<0.05; **P<0.01; ***P<0.001; NS: not significant (two-way ANOVA with multiple comparisons correction).
Figure 4.
Figure 4.
Inflammatory cytokine and chemokine profile in erythrocytosis mice. (A and B) Multiplex immunoassay using plasma samples from the indicated mice (n=4 each). Heat map showing log2-fold changes in concentration of 32 cytokines/chemokines normalized by mean value of control samples. Gray box indicates undetectable. Concentration of individual cytokines/chemokines are shown in (B). (C) The expression of Il1b, Il6, and Il12 mRNA in sorted bone marrow (BM) macrophages from the indicated mice. Data are mean±Standard Deviation (s.d.). *P<0.05; **P<0.01; ***P<0.001; ****P<0.0001; NS: not significant (two-way ANOVA with multiple comparisons correction).
Figure 5.
Figure 5.
The effect of erythropoietin (EPO) injection on macrophage populations. (A) Recombinant human EPO (rhEPO) or phosphate buffered saline (PBS) were daily injected intraperitoneally (ip) into wild-type mice for seven days (n=4 each). (B) White blood cell (WBC) counts, red blood cell (RBC) counts, hematocrit (Ht), hemoglobin (Hb), and platelet (Plts) counts in peripheral blood (PB) from the control mice (Vehicle) and rhEPO injected mice (rhEPO) on day 4 and day 8. Data are mean±Standard Deviation (s.d.). (C) Spleen weight in the indicated mice. Data are mean±s.d. (D and E) Flow cytometric analysis of bone marrow (BM)/spleen (SP) macrophages from the indicated mice. Data are mean±s.d. *P<0.05; **P<0.01; ***P<0.001; ****P<0.0001; NS: not significant (Student t-test).
Figure 6.
Figure 6.
Most of the macrophages do not express EPOR. (A) GFP-reporter mice using EPOR-Cre knock-in allele and Rosa26/loxP-Stop-loxP (LSL)/eGFP allele. (B) Expression pattern of EPOR-Cre (GFP) in bone marrow (BM) single-cell-gated macrophage fraction. (C) CD71 and Ter119 expression pattern in the single-cell-gated BM macrophage population in (B). Expression pattern of EPOR-Cre (GFP) in the individual fractions are shown. (D) Wright Giemsa staining of single-cell-sorted macrophages in the indicated fraction defined in (C). Samples were prepared with normal FACS buffer. (E) Flow cytometric analysis of the same BM sample with different preparation (normal FACS buffer with or without EDTA). Representative plots are shown. (F) Wright Giemsa staining of single-cell-sorted macrophages in the indicated fraction defined in (E) with the FACS buffer containing 2 mM EDTA. (G) Summary of this study. EPOR signaling activation expands erythroid and macrophage populations.

References

    1. Miyake T, Kung CK, Goldwasser E. Purification of human erythropoietin. J Biol Chem. 1977;252(15):5558–5564. - PubMed
    1. Jacobs K, Shoemaker C, Rudersdorf R, et al. Isolation and characterization of genomic and cDNA clones of human erythropoietin. Nature. 1985;313(6005):806–810. - PubMed
    1. D’Andrea AD, Lodish HF, Wong GG. Expression cloning of the murine erythropoietin receptor. Cell. 1989;57(2):277–285. - PubMed
    1. Constantinescu SN, Wu H, Liu X, Beyer W, Fallon A, Lodish HF. The anemic Friend virus gp55 envelope protein induces erythroid differentiation in fetal liver colony-forming units-erythroid. Blood. 1998; 91(4):1163–1172. - PubMed
    1. Witthuhn BA, Quelle FW, Silvennoinen O, et al. JAK2 associates with the erythropoietin receptor and is tyrosine phosphorylated and activated following stimulation with erythropoietin. Cell. 1993;74(2):227–236. - PubMed

Publication types

MeSH terms