

Do 16 Polycyclic Aromatic Hydrocarbons Represent PAH Air Toxicity?
- PMID: 29051449
- PMCID: PMC5634701
- DOI: 10.3390/toxics5030017
Do 16 Polycyclic Aromatic Hydrocarbons Represent PAH Air Toxicity?
Abstract
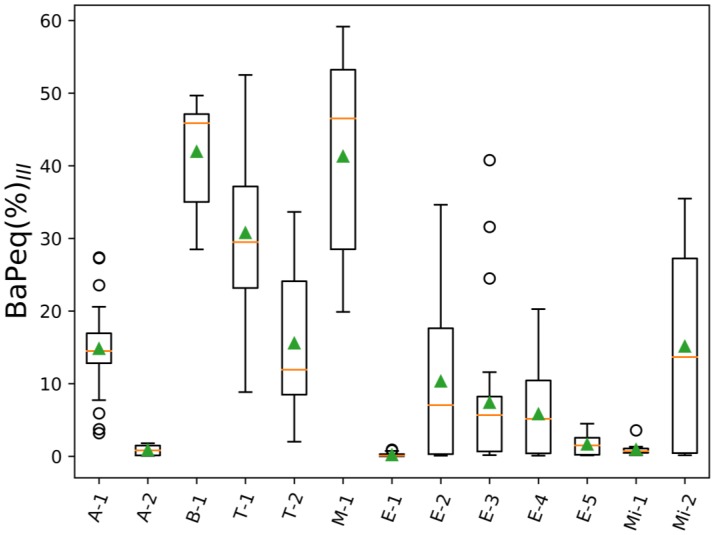
Estimation of carcinogenic potency based on analysis of 16 polycyclic aromatic hydrocarbons (PAHs) ranked by U.S. Environmental Protection Agency (EPA) is the most popular approach within scientific and environmental air quality management communities. The majority of PAH monitoring projects have been focused on particle-bound PAHs, ignoring the contribution of gas-phase PAHs to the toxicity of PAH mixtures in air samples. In this study, we analyzed the results of 13 projects in which 88 PAHs in both gas and particle phases were collected from different sources (biomass burning, mining operation, and vehicle emissions), as well as in urban air. The aim was to investigate whether 16 particle-bound U.S. EPA priority PAHs adequately represented health risks of inhalation exposure to atmospheric PAH mixtures. PAH concentrations were converted to benzo(a)pyrene-equivalent (BaPeq) toxicity using the toxic equivalency factor (TEF) approach. TEFs of PAH compounds for which such data is not available were estimated using TEFs of close isomers. Total BaPeq toxicities (∑88BaPeq) of gas- and particle-phase PAHs were compared with BaPeq toxicities calculated for the 16 particle-phase EPA PAH (∑16EPABaPeq). The results showed that 16 EPA particle-bound PAHs underrepresented the carcinogenic potency on average by 85.6% relative to the total (gas and particle) BaPeq toxicity of 88 PAHs. Gas-phase PAHs, like methylnaphthalenes, may contribute up to 30% of ∑88BaPeq. Accounting for other individual non-EPA PAHs (i.e., benzo(e)pyrene) and gas-phase PAHs (i.e., naphthalene, 1- and 2-methylnaphthalene) will make the risk assessment of PAH-containing air samples significantly more accurate.
Keywords: air samples; gas and particle phase PAHs; polycyclic aromatic hydrocarbons; toxic equivalency factor.
Conflict of interest statement
The authors declare no conflicts of interest.
Figures


References
-
- Zhang Y.X., Tao S. Global atmospheric emission inventory of polycyclic aromatic hydrocarbons (PAHs) for 2004. Atmos. Environ. 2009;43:812–819. doi: 10.1016/j.atmosenv.2008.10.050. - DOI
-
- Yuan H.S., Tao S., Li B.G., Lang C., Cao J., Coveney M.R. Emission and outflow of polycyclic aromatic hydrocarbons from wildfires in China. Atmos. Environ. 2008;42:6828–6835. doi: 10.1016/j.atmosenv.2008.05.033. - DOI
-
- Nikolaou K., Masclet P., Mouvier G. Sources and chemical reactivity of polynuclear aromatic hydrocarbons in the atmosphere—A critical review. Sci. Total Environ. 1984;32:103–132. doi: 10.1016/0048-9697(84)90125-6. - DOI
-
- Raga G.B., Baumgardner D., Ulke A.G., Brizuela M.T., Kucienska B. The environmental impact of the Puyehue-Cordon Caulle 2011 volcanic eruption on Buenos Aires. Nat. Hazards Earth Syst. Sci. 2013;13:2319–2330. doi: 10.5194/nhess-13-2319-2013. - DOI
LinkOut - more resources
Full Text Sources
Other Literature Sources
Research Materials
