. 2017 Oct 19;8(1):1050.
doi: 10.1038/s41467-017-01018-0.

Genomic landscape associated with potential response to anti-CTLA-4 treatment in cancers

Affiliations

Genomic landscape associated with potential response to anti-CTLA-4 treatment in cancers

Chan-Young Ock et al. Nat Commun. .

Abstract

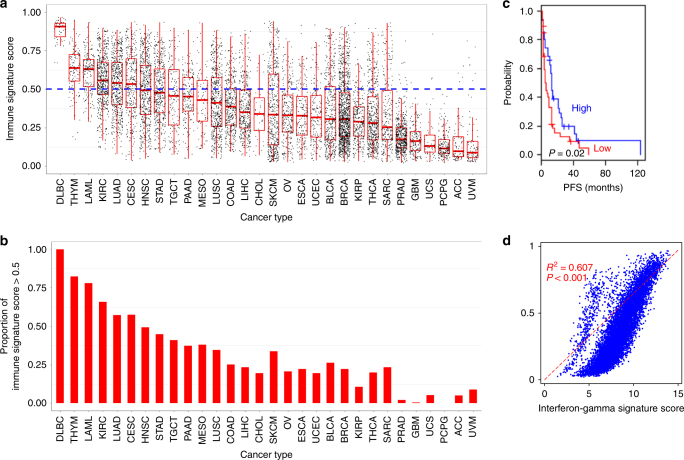
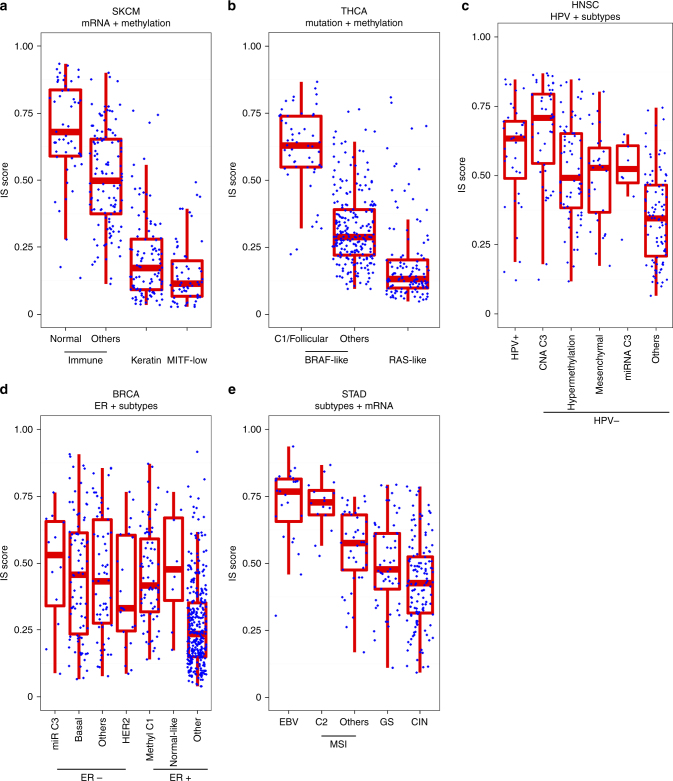
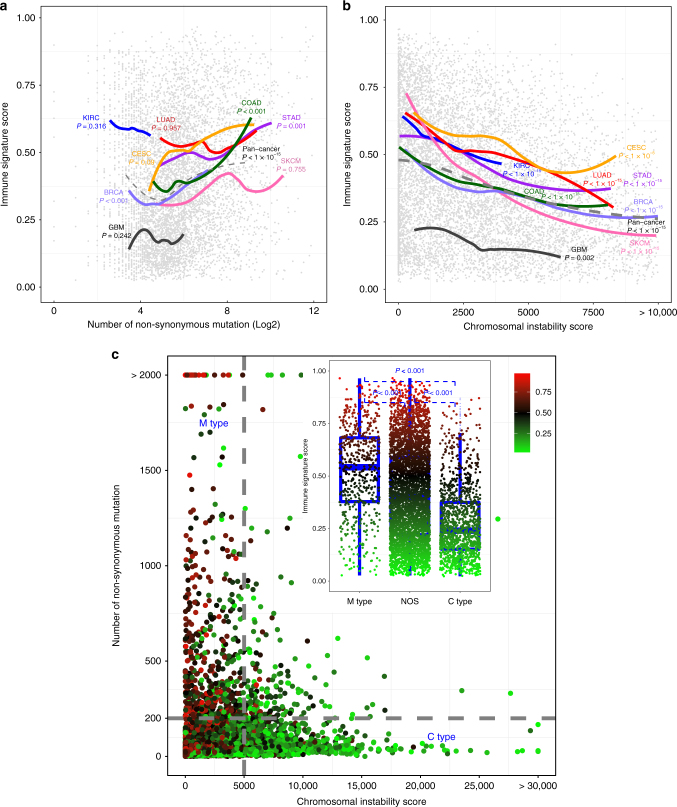
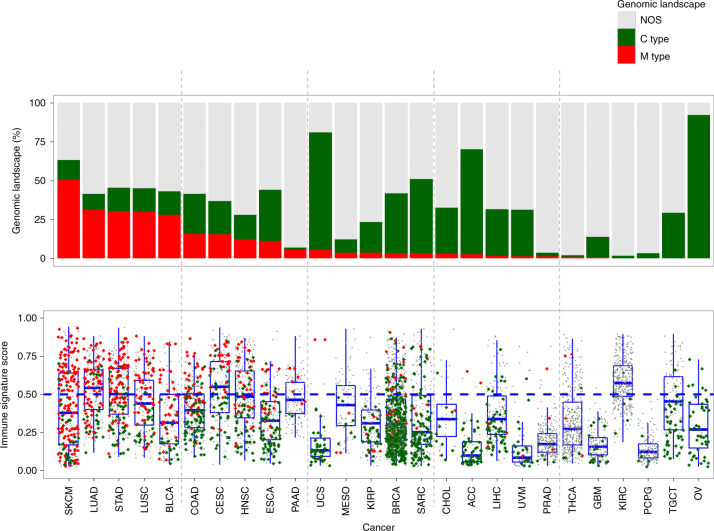
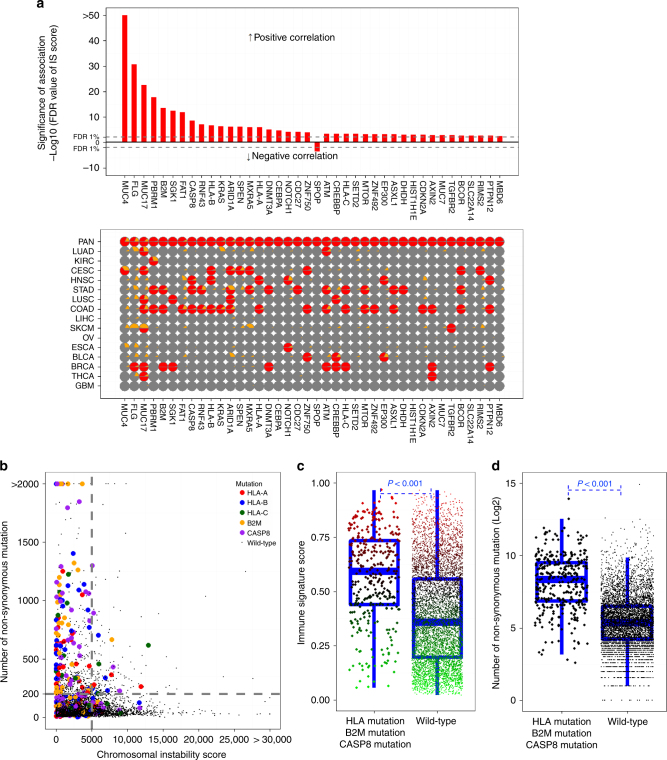
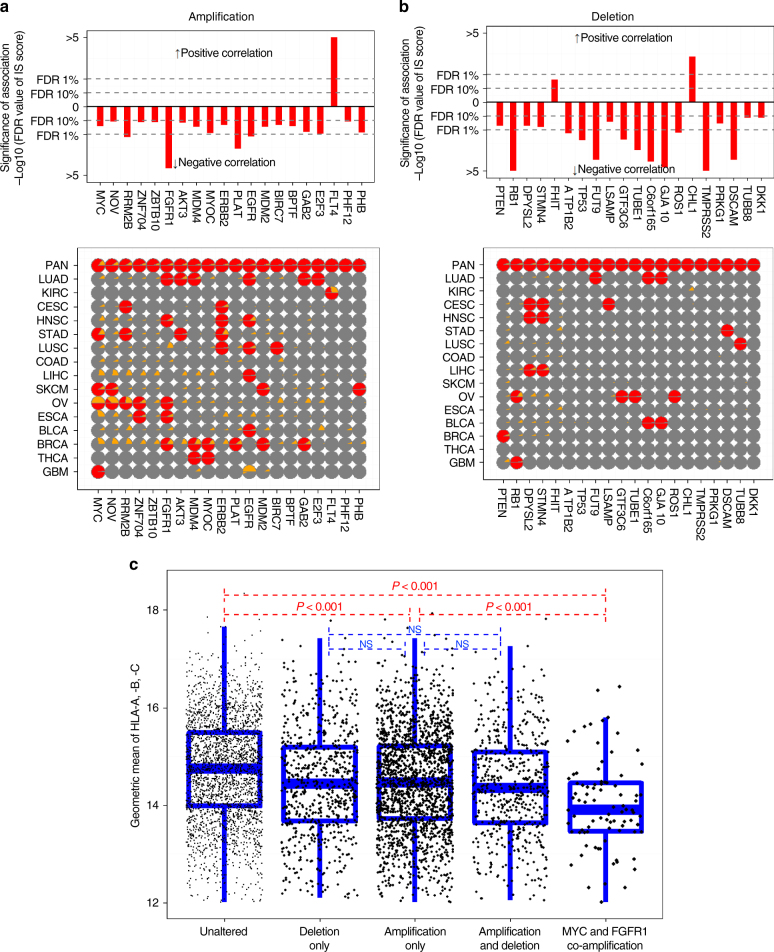
Immunotherapy has emerged as a promising anti-cancer treatment, however, little is known about the genetic characteristics that dictate response to immunotherapy. We develop a transcriptional predictor of immunotherapy response and assess its prediction in genomic data from ~10,000 human tissues across 30 different cancer types to estimate the potential response to immunotherapy. The integrative analysis reveals two distinct tumor types: the mutator type is positively associated with potential response to immunotherapy, whereas the chromosome-instable type is negatively associated with it. We identify somatic mutations and copy number alterations significantly associated with potential response to immunotherapy, in particular treatment with anti-CTLA-4 antibody. Our findings suggest that tumors may evolve through two different paths that would lead to marked differences in immunotherapy response as well as different strategies for evading immune surveillance. Our analysis provides resources to facilitate the discovery of predictive biomarkers for immunotherapy that could be tested in clinical trials.


Conflict of interest statement

The authors declare no competing financial interests.

Figures

Fig. 1
Fig. 1
Immune signature reflecting response to immunotherapy from human and mouse cancer tissues. a Expression patterns of genes significantly associated with response to immunotherapy in training cohort. Pretreatment biopsies from patients with metastatic melanoma were used to generate gene expression data. Genes whose expression is significantly different between responders and non-responders were selected (105 genes, P < 0.005 and 1.5-fold difference). The data are presented in matrix format, with rows representing the individual gene and columns representing each tissue. Each cell in the matrix represents the expression level of a gene feature in an individual tissue. Red and green reflect high-expression and low-expression levels, respectively, as indicated in the scale bar (log 2 transformed scale). Immune signature (IS) scores are presented as color index in blue (0−1 scale). b Expression patterns of immune signature genes and IS scores from mouse mesothelioma model treated with anti-CTLA-4 antibodies. c Expression patterns of immune signature genes and IS scores from human melanoma tissues treated with ipilimumab. df Receiver operating characteristics (ROC) analysis of IS scores from each prediction. Robustness of IS scores identifying responders to immunotherapy was estimated by area under curve (AUC) from ROC analysis. d Human melanoma treated with MAGE-A3 antigen, e mouse mesothelioma model treated with anti-CTLA-4 antibodies, f human melanoma treated with ipilimumab. (CI: 95% confident internal of AUC). g, h Kaplan−Meier plots of overall survival (OS) and progression-free survival (PFS) of advanced melanoma patients treated with ipilimumab. Patients were stratified according to IS scores (high >0.5). See also Supplementary Figs. 1−7 and Supplementary Data 1, 2
Fig. 2
Fig. 2
Immune signature scores and potential responders to immunotherapy across major cancer types. a Immune signature (IS) score calculated by Bayesian probability of immune signature is plotted according to cancer types. Each black dot represents IS score, and red lines in the box represent upper 75%, median, and lower 25% values of each cancer type. Blue line represents IS score of 0.5. b Proportion of potential responders to immunotherapy (IS score > 0.5) is shown according to cancer types. c Kaplan−Meier plots of progression-free survival (PFS) of advanced melanoma patients in TCGA treated with immunotherapy. Of 472 patients with melanoma, only 78 patients treated with immunotherapy were included in analysis. Patients were stratified according to IS scores (high > 0.5). d Association between IS score and interferon-gamma signature score. Scatter plot and fitted dash line showed the significant association between IS score and interferon-gamma signature score. Abbreviation of cancer type was referred from The Cancer Genome Atlas tag. See also Supplementary Figs. 8−11 and Supplementary Data 3, 4.
Fig. 3
Fig. 3
Molecular subtypes of cancers associated with potential response to immunotherapy. a Melanoma tumors were grouped according to mRNA subtypes first and immune-high subtype was further stratified by methylation subtypes (Normal-like or others). b Thyroid tumors were grouped according to mutation subtypes first and BRAF-like subtype was further stratified by methylation subtypes (C1/Follicular or Others). c Head and neck squamous cell carcinoma tumors were grouped by HPV-infection status first and HPV-negative tumors were further stratified by molecular subtypes. d Breast tumors were grouped by ER status first and tumors were further stratified by molecular subtypes. e Stomach tumors were grouped by molecular subtypes first and MSI tumors were further stratified by mRNA subtype (C2 or others). Blue dot represents IS score, and red lines in the box represent upper 75%, median, and lower 25% values of molecular subtype. See also Supplementary Figs. 12−19
Fig. 4
Fig. 4
Two types of tumors distinct in genomic alterations and response to immunotherapy. a Scatter plots between mutation rates and IS scores. Dotted line represents global regression curve between mutation rates and IS scores in all cancers. Solid lines represent local regression curves between mutation rates and IS scores in each cancer as indicated. b Scatter plots between chromosome instability (CIN) scores and IS scores. Dotted line represents global regression curve between two scores in all cancers. Solid lines represent local regression curves between two scores in each cancer as indicated. CIN scores were defined by sum of square of gene-level gistic 2 value. c Scatter plots between mutation rates and CIN scores. Size and colors of dots represents IS scores as indicated in reference index. The tumor with high mutational burden (M type) is defined by number of non-synonymous mutation more than 200 as described in previous study, whereas the tumor with high chromosomal instability (C-type) is defined by CIN score more than 5000. Otherwise, tumors are classified as not otherwise specified (NOS). IS score according to M type or C type is summarized inside the graph. Blue lines in the box represent upper 75%, median, and lower 25% values of subtype. See also Supplementary Figs. 20−28
Fig. 5
Fig. 5
Distribution of genomic cancer types in each cancer. (top) A systematic overview of proportion of mutator type tumors (M type, red), chromosome-instable tumors (C type, green), and not otherwise specified (NOS) (bottom) immune signature (IS) score in each cancer. Blue lines in the box represent upper 75%, median, and lower 25% values of cancer type. Abbreviation of cancer type was referred from The Cancer Genome Atlas tag name
Fig. 6
Fig. 6
Somatic mutations associated with immune signature scores. a Top: the significant pan-cancer-wide association of mutation rates with immune signature (IS) scores. Red bars represent significance (FDR) of association of mutation rate with IS score in each gene. Dashed line indicates 1% threshold of FDR. Bottom: the significance of association in each cancer type. Red or gray indicate significance or insignificance, respectively, and yellow indicates the frequency of mutations in each gene. b Scatter plots between mutation rates and chromosomal instability scores in all tumors highlighted with mutations in HLA-A, HLA-B, HLA-C, B2M, and CASP8. c, d IS score c and number of mutation d in tumors with and without mutations in HLA-A, HLA-B, HLA-C, B2M, and CASP8. Blue lines in the box represent upper 75%, median, and lower 25% values of subtype. See also Supplementary Data 5
Fig. 7
Fig. 7
Somatic copy number alterations associated with immune signature scores. a, b Top: the significant pan-cancer-wide association of amplified a and deleted b genes with immune signature (IS) scores. Red bars represent significance (FDR) of association of amplification with IS scores in each gene. Bottom: The significance of association in each cancer type. Red or gray indicate significance or insignificance, respectively, and yellow indicates the frequency of amplification in each gene. c Mean expression of HLA-A, HLA-B, and HLA-C in not significantly altered, deleted only, amplified only, both amplified and deleted, and MYC and FGFR1 co-amplified tissues. Blue lines in the box represent upper 75%, median, and lower 25% values of subtype. See also Supplementary Fig. 29 and Supplementary Data 6, 7

References

    1. Dong H, et al. Tumor-associated B7-H1 promotes T-cell apoptosis: a potential mechanism of immune evasion. Nat. Med. 2002;8:793–800. doi: 10.1038/nm0902-1039c. - DOI - PubMed
    1. Leach DR, Krummel MF, Allison JP. Enhancement of antitumor immunity by CTLA-4 blockade. Science. 1996;271:1734–1736. doi: 10.1126/science.271.5256.1734. - DOI - PubMed
    1. Wang E, et al. Antitumor vaccines, immunotherapy and the immunological constant of rejection. IDrugs. 2009;12:297–301. - PMC - PubMed
    1. Rosenberg SA, et al. Use of tumor-infiltrating lymphocytes and interleukin-2 in the immunotherapy of patients with metastatic melanoma. A preliminary report. N. Engl. J. Med. 1988;319:1676–1680. doi: 10.1056/NEJM198812223192527. - DOI - PubMed
    1. Schwartzentruber DJ, et al. gp100 peptide vaccine and interleukin-2 in patients with advanced melanoma. N. Engl. J. Med. 2011;364:2119–2127. doi: 10.1056/NEJMoa1012863. - DOI - PMC - PubMed

Publication types