. 2017 Oct 19;7(1):13534.
doi: 10.1038/s41598-017-13903-1.

Network analysis of EMT and MET micro-RNA regulation in breast cancer

Affiliations

Network analysis of EMT and MET micro-RNA regulation in breast cancer

Diana Drago-García et al. Sci Rep. .

Abstract

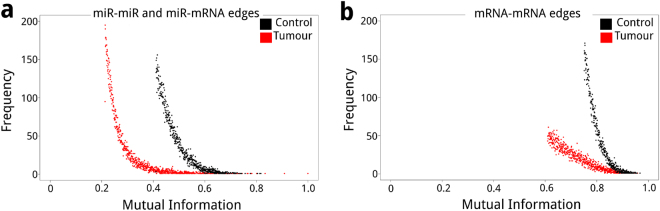
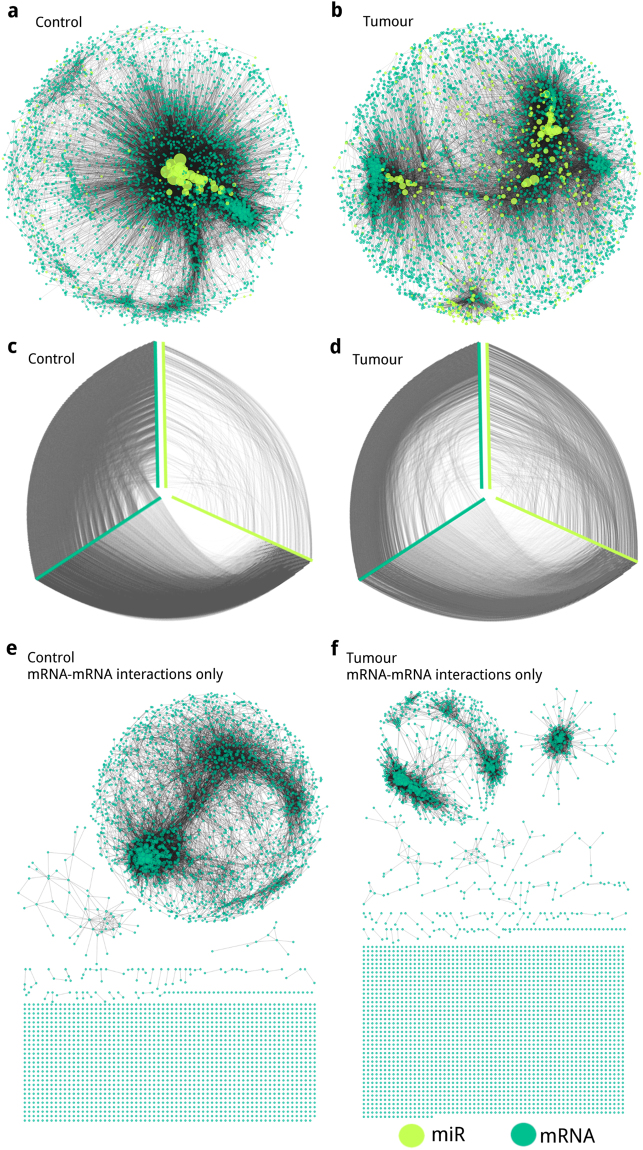
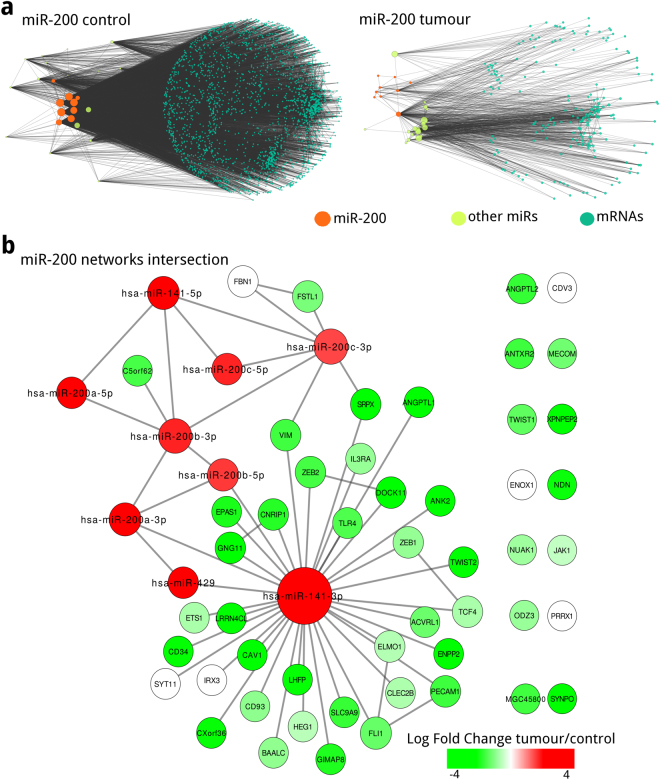
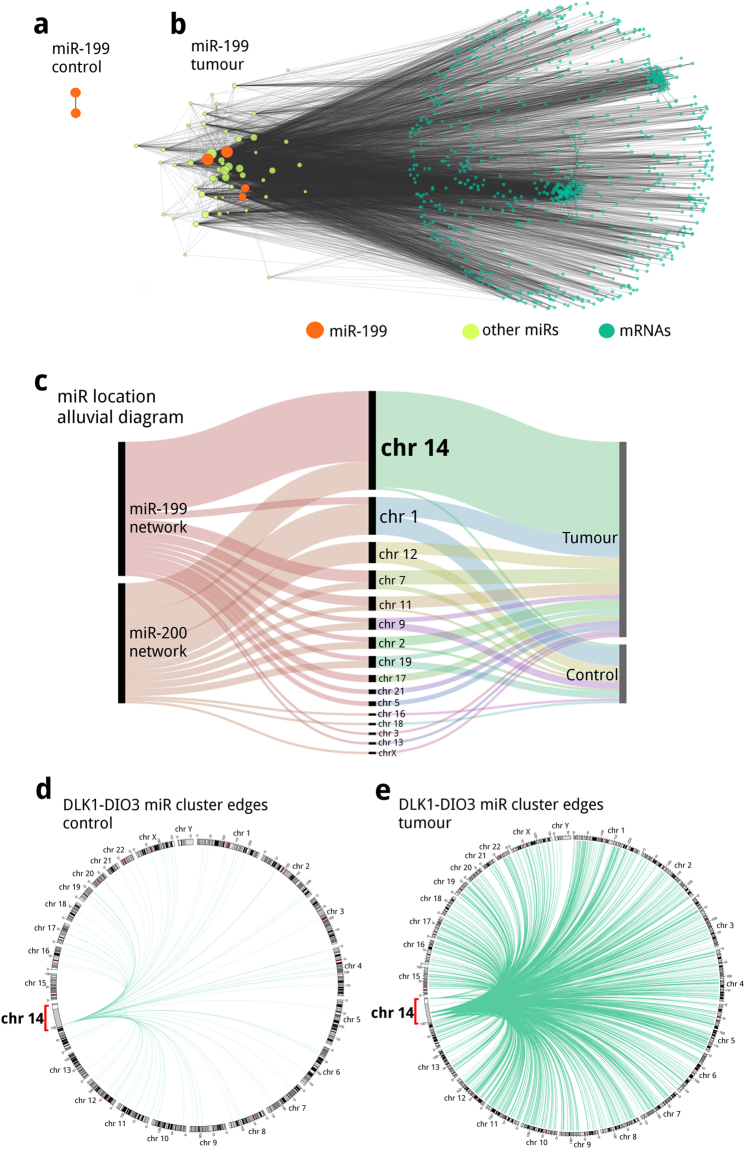
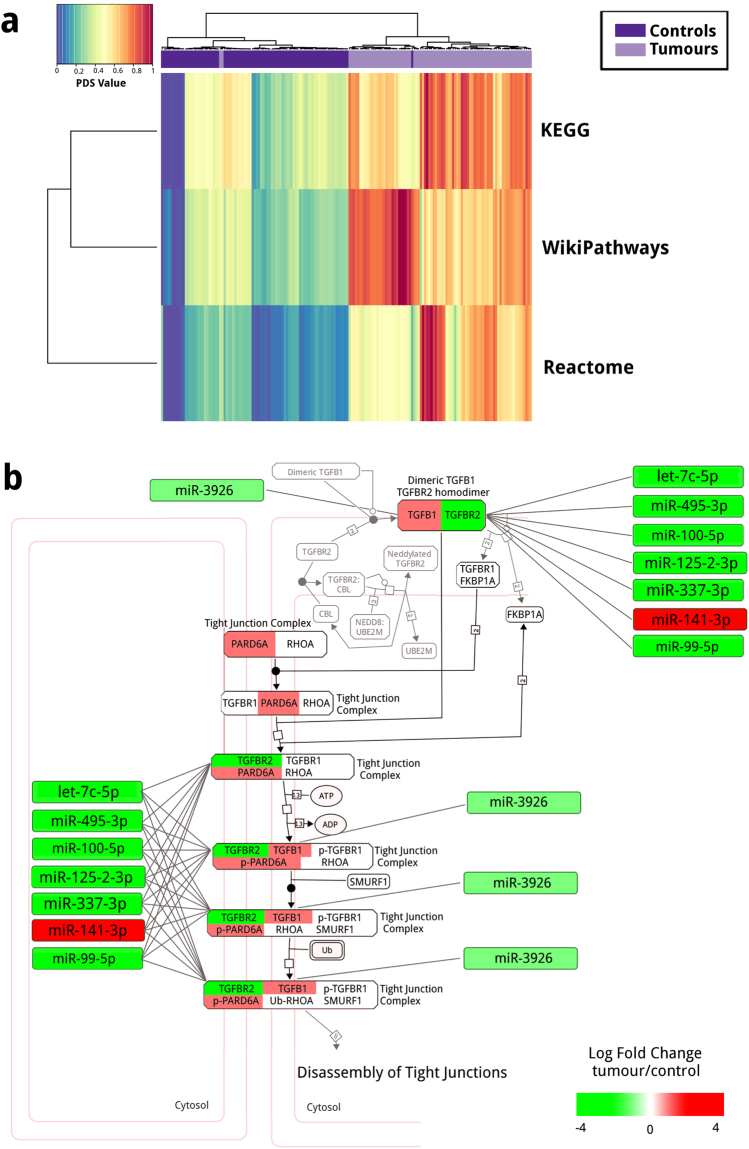
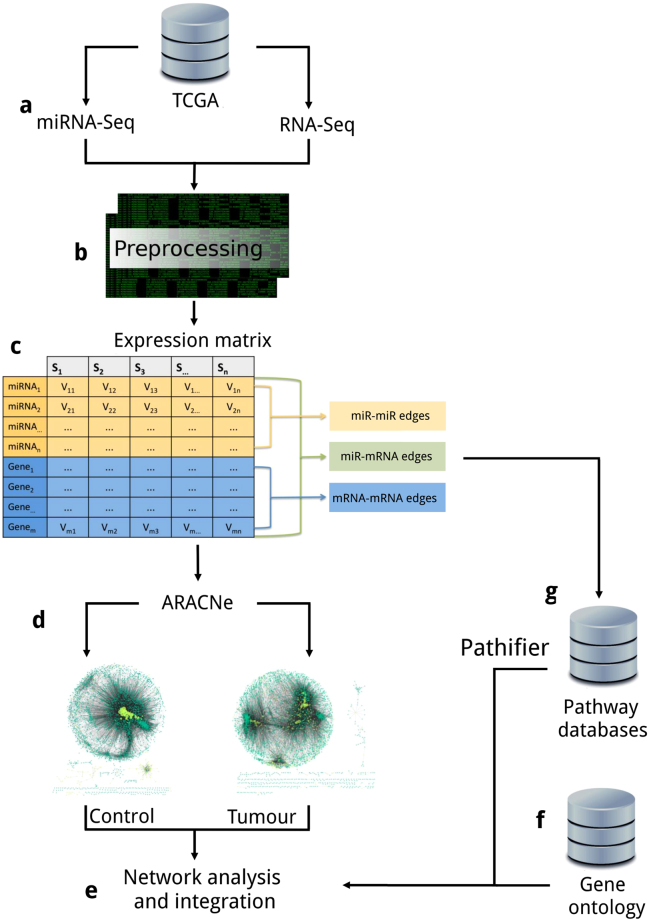
Over the last years, microRNAs (miRs) have shown to be crucial for breast tumour establishment and progression. To understand the influence that miRs have over transcriptional regulation in breast cancer, we constructed mutual information networks from 86 TCGA matched breast invasive carcinoma and control tissue RNA-Seq and miRNA-Seq sequencing data. We show that miRs are determinant for tumour and control data network structure. In tumour data network, miR-200, miR-199 and neighbour miRs seem to cooperate on the regulation of the acquisition of epithelial and mesenchymal traits by the biological processes: Epithelial-Mesenchymal Transition (EMT) and Mesenchymal to Epithelial Transition (MET). Despite structural differences between tumour and control networks, we found a conserved set of associations between miR-200 family members and genes such as VIM, ZEB-1/2 and TWIST-1/2. Further, a large number of miRs observed in tumour network mapped to a specific chromosomal location in DLK1-DIO3 (Chr14q32); some of those miRs have also been associated with EMT and MET regulation. Pathways related to EMT and TGF-beta reinforce the relevance of miR-200, miR-199 and DLK1-DIO3 cluster in breast cancer. With this approach, we stress that miR inclusion in gene regulatory network construction improves our understanding of the regulatory mechanisms underlying breast cancer biology.


Conflict of interest statement

The authors declare that they have no competing interests.

Figures

Figure 1
Figure 1
MI histograms for network edges; (a) overlayed miR-miR and miR-mRNA largest connected component edges for networks inferred from tumour (red) and control (black) data (0.259% strongest edges), and (b) mRNA-mRNA edges for the largest connected component edges for networks inferred from tumour (red) and control (black) data (0.013% strongest edges).
Figure 2
Figure 2
Representation of Large component networks inferred from (a) control and (b) tumour data. Hiveplot representation of the networks inferred from (c) control, and (d) tumour data. Yellow-green nodes represent miRs, meanwhile turquoise nodes represent mRNAs. For (a) and (b) node size is proportional to node degree. For (c) and (d) hiveplot visualization: network nodes are represented in the axes ordered by increasing degree from its centre; edges between yellow-green axes represent miR-miR edges; between turquoise axes the mRNA-mRNA edges; and between yellow-green and turquoise axes the miR-mRNA ones. Effect on component disintegration after mRNA removal from the largest component of the networks inferred from (e) control and (f) tumour data.
Figure 3
Figure 3
miR-200 first neighbours of the sub-networks inferred from (a) control and (b) tumour data; node sizes correspond to node degree. (c) Intersection of the miR-200 networks inferred from control and tumour data, conserved nodes and edges are coloured according to their differential expression. Notice that miRs are overexpressed meanwhile the majority of mRNAs are underexpressed.
Figure 4
Figure 4
miR-199 first neighbours networks for (a) controls and (b) tumours; node sizes correspond to node degree. (c) Alluvial diagram of the chromosomal location of miRs present in miR-200 and miR-199 first neighbours networks. Circos plot representing the miRs in DLK1-DIO3 cluster (highlighted in red and amplified 100x) direct edges (miR-miR and miR-mRNA) from the Large component (d) controls and (e) tumours networks.
Figure 5
Figure 5
Pathway Analysis. (a) Pathway Deregulation Score heatmap for EMT related pathways from Reactome, WikiPathways and KEGG. (b) miRs from the network inferred from tumour data have associations with genes in the pathway (Nodes are coloured according to their expression).
Figure 6
Figure 6
Pipeline description. (a) Paired RNAseq and miRseq expression data from 86 patients were obtained from TCGA. (b) Data preprocessing and normalization. (c) Normalized expression matrix with miR and mRNA (rows) expression values for each sample (columns). (d) Network construction by the ARACNE algorithm with the expression matrix as input. (e) Network analysis and result integration. (f) Gene ontology enrichment analysis from resulting network nodes (mRNAs). (g) Pathifier analysis from resulting network nodes (mRNAs) with first neighbour associations with miR-200 and DLK1-DIO3 miRs.

References

    1. Ferlay J, et al. Cancer incidence and mortality worldwide: sources, methods and major patterns in globocan 2012. International journal of cancer. 2015;136:E359–E386. doi: 10.1002/ijc.29210. - DOI - PubMed
    1. Lal EOA, O’Day E. Micrornas and their target gene networks in breast cancer. Breast Cancer Research. 2010;12:201. doi: 10.1186/bcr2484. - DOI - PMC - PubMed
    1. Garofalo M, Croce C. M. micrornas: Master regulators as potential therapeutics in cancer. Annual review of pharmacology and toxicology. 2011;51:25–43. doi: 10.1146/annurev-pharmtox-010510-100517. - DOI - PubMed
    1. Cho WC. Oncomirs: the discovery and progress of micrornas in cancers. Molecular cancer. 2007;6:1. doi: 10.1186/1476-4598-6-1. - DOI - PMC - PubMed
    1. Cai Y, Yu X, Hu S, Yu J. A brief review on the mechanisms of mirna regulation. Genomics, proteomics & bioinformatics. 2009;7:147–154. doi: 10.1016/S1672-0229(08)60044-3. - DOI - PMC - PubMed

Publication types