. 2017 Oct 10:14:34.
doi: 10.1186/s12014-017-9169-6. eCollection 2017.

A multiplex platform for the identification of ovarian cancer biomarkers

Affiliations

A multiplex platform for the identification of ovarian cancer biomarkers

Kristin L M Boylan et al. Clin Proteomics. .

Abstract

Background: Currently, there are no FDA approved screening tools for detecting early stage ovarian cancer in the general population. Development of a biomarker-based assay for early detection would significantly improve the survival of ovarian cancer patients.

Methods: We used a multiplex approach to identify protein biomarkers for detecting early stage ovarian cancer. This new technology (Proseek® Multiplex Oncology Plates) can simultaneously measure the expression of 92 proteins in serum based on a proximity extension assay. We analyzed serum samples from 81 women representing healthy, benign pathology, early, and advanced stage serous ovarian cancer patients.

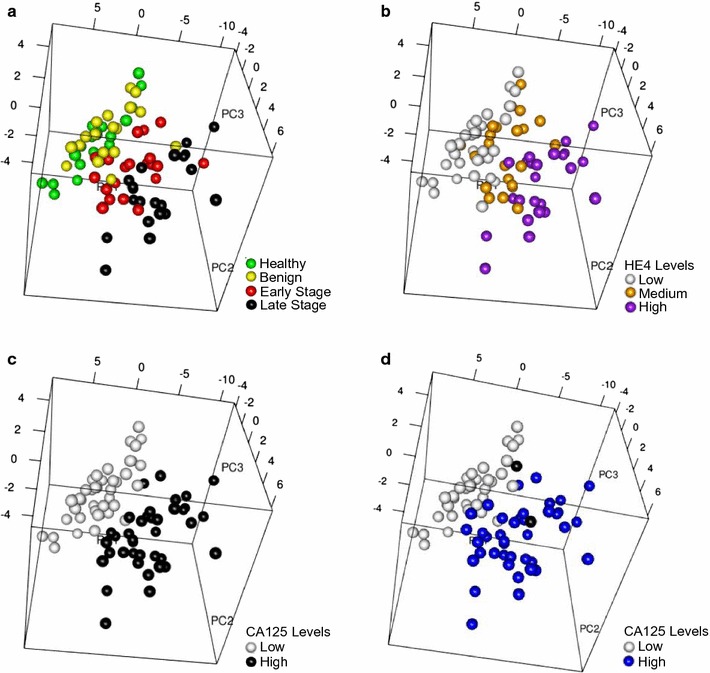
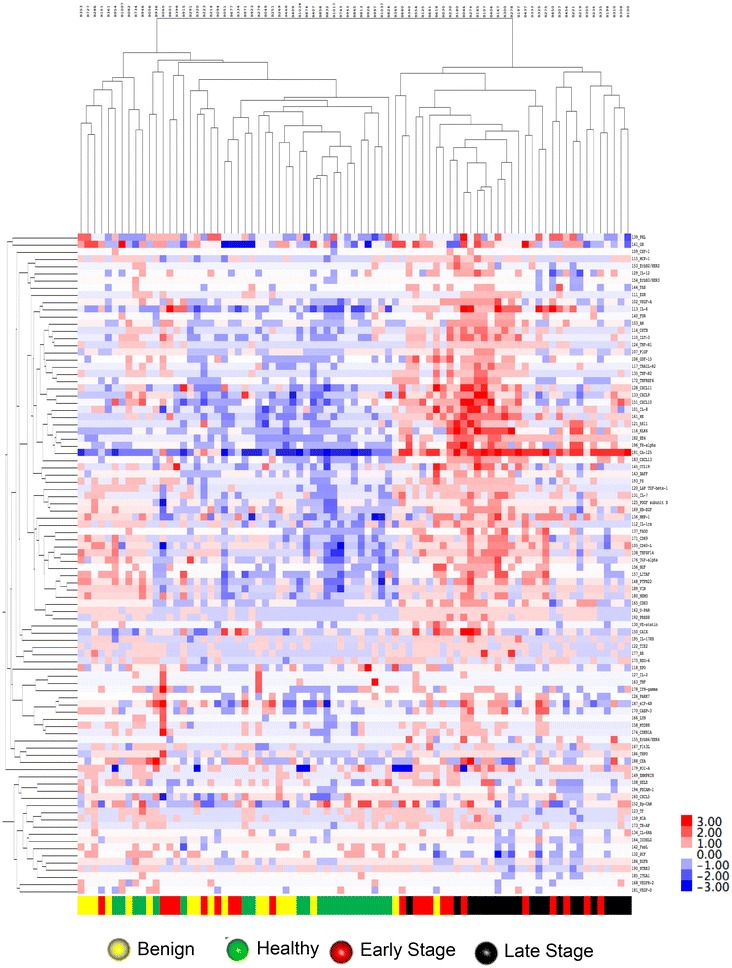
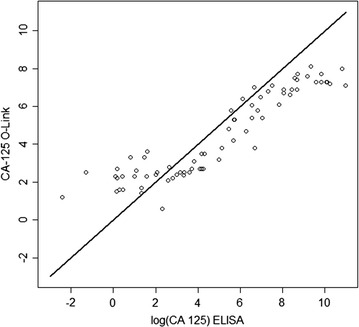
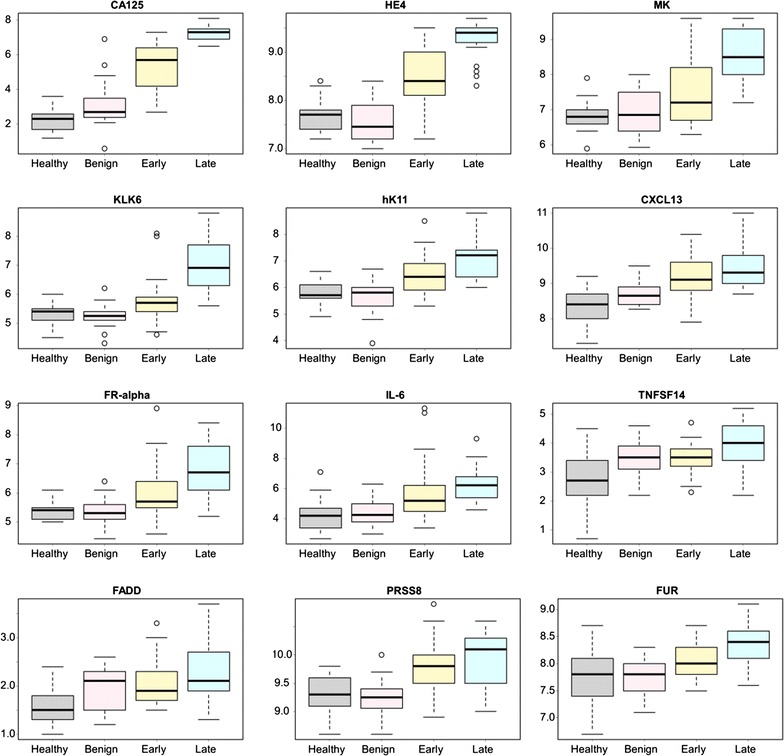
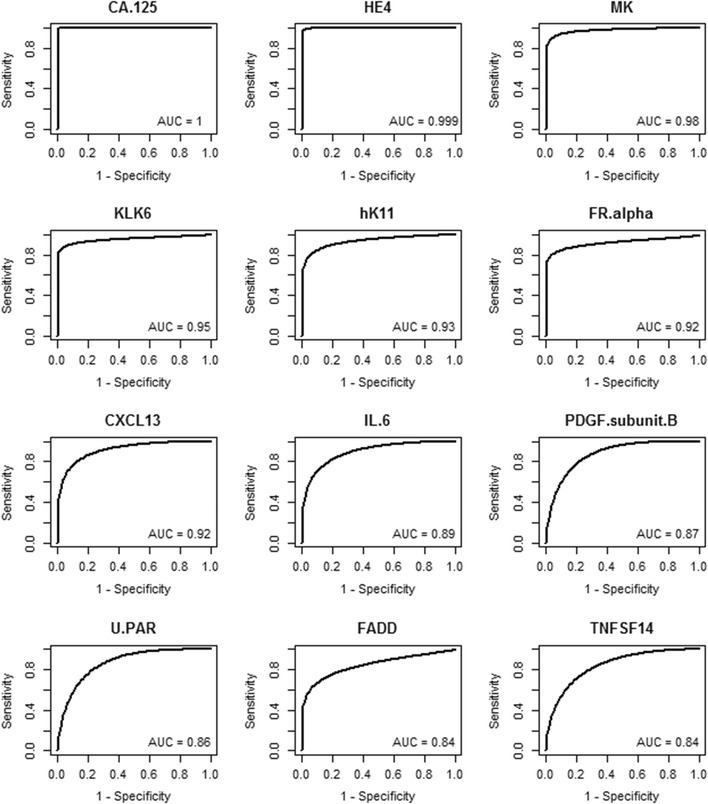
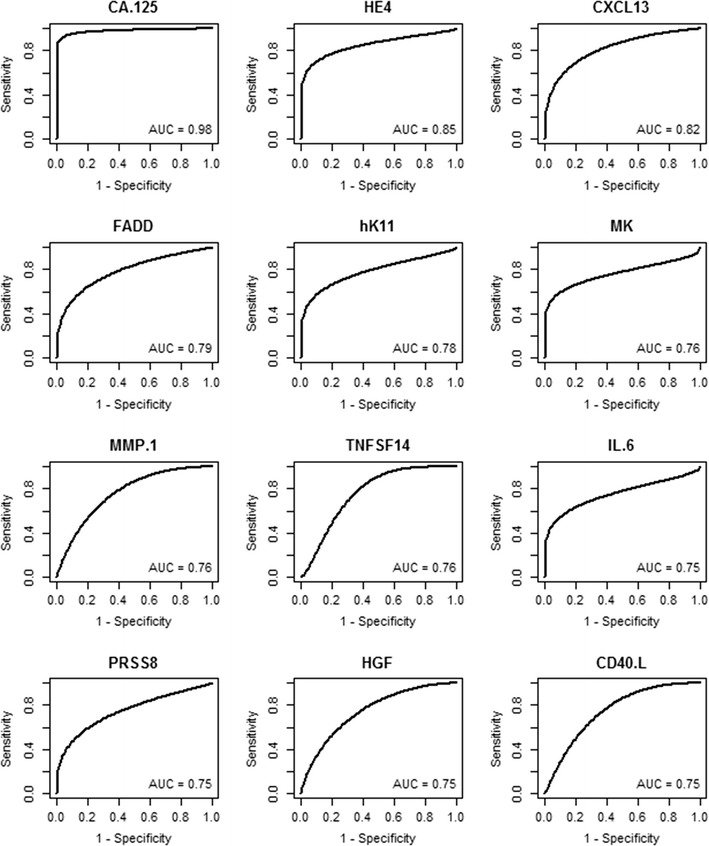
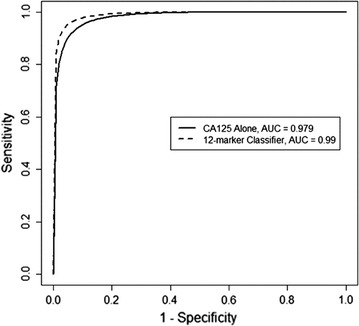
Results: Principle component analysis and unsupervised hierarchical clustering separated patients into cancer versus non-cancer subgroups. Data from the Proseek® plate for CA125 levels exhibited a strong correlation with current clinical assays for CA125 (correlation coefficient of 0.89, 95% CI 0.83, 0.93). CA125 and HE4 were present at very low levels in healthy controls and benign cases, while higher levels were found in early stage cases, with highest levels found in the advanced stage cases. Overall, significant trends were observed for 38 of the 92 proteins (p < 0.001), many of which are novel candidate serum biomarkers for ovarian cancer. The area under the ROC curve (AUC) for CA125 was 0.98 and the AUC for HE4 was 0.85 when comparing early stage ovarian cancer versus healthy controls. In total, 23 proteins had an estimated AUC of 0.7 or greater. Using a naïve Bayes classifier that combined 12 proteins, we improved the sensitivity corresponding to 95% specificity from 93 to 95% when compared to CA125 alone. Although small, a 2% increase would have a significant effect on the number of women correctly identified when screening a large population.

Conclusions: These data demonstrate that the Proseek® technology can replicate the results established by conventional clinical assays for known biomarkers, identify new candidate biomarkers, and improve the sensitivity and specificity of CA125 alone. Additional studies using a larger cohort of patients will allow for validation of these biomarkers and lead to the development of a screening tool for detecting early stage ovarian cancer in the general population.

Keywords: Biomarkers; CA125; HE4; Multiplex; Ovarian cancer; Proseek®; Proximity extension assay.


Figures

Fig. 1
Fig. 1
Principal component analysis of Proseek® protein expression data. Principal component analysis plots were based on expression levels of 92 proteins measured in the sera of 81 patients using the Proseek® Oncology I v2 Multiplex plates. a Colored circles represent healthy (green), benign (yellow), early stage ovarian cancer (red), and late stage ovarian cancer (black) serum samples. b Colored circles represent low (white), medium (orange) or high (purple) levels of HE4 in the serum samples based on Proseek® data. c Colored circles represent low (white) or high (black) CA125 levels measured in the serum samples on the Proseek® plates. d Colored circles represent CA125 levels measured in the serum samples by ELISA using the clinical cutoff values of < 35 U/ml (white) and > 35 U/ml (blue). The two black circles represent one benign patient and one early stage ovarian cancer patient who did not have ELISA CA125 values reported in their medical records
Fig. 2
Fig. 2
Unsupervised hierarchical clustering of Proseek® protein expression data. Unsupervised hierarchical clustering was based on mean-centered log2 transformed protein expression data of 92 Proseek® Oncology Iv2 proteins (Correlation uncentered, average linkage) measured in the sera of 81 patients. Dark red indicates high levels of the protein relative to the average value, white indicates the average value, and dark blue indicates that the protein levels are below average (shown in the color bar on the right hand side). Color bar at the bottom indicates patient classification: healthy (green), benign (yellow), early stage ovarian cancer (red), and late stage ovarian cancer (black)
Fig. 3
Fig. 3
Comparison of the CA125 values obtained by ELISA versus the Proseek® plate. Scatterplot comparison of the CA125 values for each of the 81 serum samples obtained by ELISA versus the Olink Proseek® Oncology I v2 plate. Correlation coefficient of 0.89 (95% CI 0.83, 0.93)
Fig. 4
Fig. 4
Proteins that showed an increasing trend in Proseek® values in the four patient groups. The logarithmic output of the top 12 biomarkers that showed an increasing trend in values from healthy, to benign, to early stage serous ovarian cancer, to late stage serous ovarian cancer were graphed as quantile plots: CA125, HE4, MK, KLK6, hK11, CXCL13, FR-alpha, IL-6, TNFSF14, FADD, PRSS8, and FUR. Outliers are defined as any value higher or lower than 1.5 multiplied by the interquartile range. A complete ranking of all 92 proteins is shown in Additional file 1
Fig. 5
Fig. 5
ROC curves for discriminating late stage ovarian cancer versus healthy women. ROC curves were graphed for the 12 proteins with the highest AUC values for discriminating late stage serous ovarian cancer versus healthy women. Data for the 25 proteins with the highest AUC values are shown in Table 2. Data for all 92 proteins is shown in Additional file 2
Fig. 6
Fig. 6
ROC curves for discriminating early stage ovarian cancer versus healthy women. ROC curves were graphed for the 12 proteins with the highest AUC values for discriminating early stage serous ovarian cancer versus healthy women. Data for the 25 proteins with the highest AUC values is shown in Table 4. Data for all 92 proteins is shown in Additional file 4
Fig. 7
Fig. 7
ROC curves for CA125 alone and the 12-protein classifier. ROC curves were graphed for discriminating early stage serous ovarian cancer versus healthy women for CA125 alone (solid line; AUC = 0.979) and the 12-protein classifier (dashed line; AUC = 0.99) developed using supervised machine learning techniques

References

    1. SEER stat fact sheets: ovary cancer. http://seer.cancer.gov/statfacts/html/ovary.html.
    1. Jelovac D, Armstrong DK. Recent progress in the diagnosis and treatment of ovarian cancer. CA Cancer J Clin. 2011;61:183–203. - PMC - PubMed
    1. Giede KC, Kieser K, Dodge J, Rosen B. Who should operate on patients with ovarian cancer? An evidence-based review. Gynecol Oncol. 2005;99:447–461. - PubMed
    1. Prensner JR, Chinnaiyan AM, Srivastava S. Systematic, evidence-based discovery of biomarkers at the NCI. Clin Exp Metastasis. 2012;29:645–652. - PMC - PubMed
    1. Terry KL, Sluss PM, Skates SJ, Mok SC, Ye B, Vitonis AF, Cramer DW. Blood and urine markers for ovarian cancer: a comprehensive review. Dis Markers. 2004;20:53–70. - PMC - PubMed