. 2017 Oct 19;10(1):61.
doi: 10.1186/s12920-017-0296-8.

A method to reduce ancestry related germline false positives in tumor only somatic variant calling

Affiliations

A method to reduce ancestry related germline false positives in tumor only somatic variant calling

Rebecca F Halperin et al. BMC Med Genomics. .

Abstract

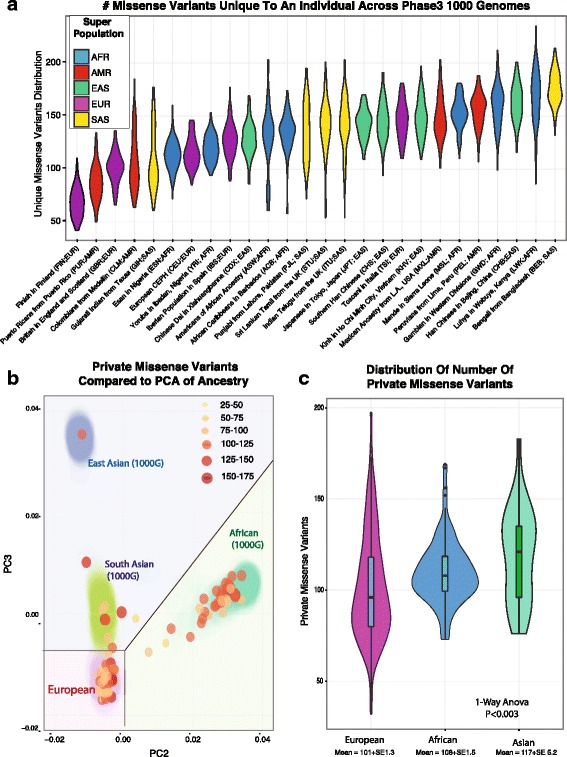
Background: Significant clinical and research applications are driving large scale adoption of individualized tumor sequencing in cancer in order to identify tumors-specific mutations. When a matched germline sample is available, somatic mutations may be identified using comparative callers. However, matched germline samples are frequently not available such as with archival tissues, which makes it difficult to distinguish somatic from germline variants. While population databases may be used to filter out known germline variants, recent studies have shown private germline variants result in an inflated false positive rate in unmatched tumor samples, and the number germline false positives in an individual may be related to ancestry.

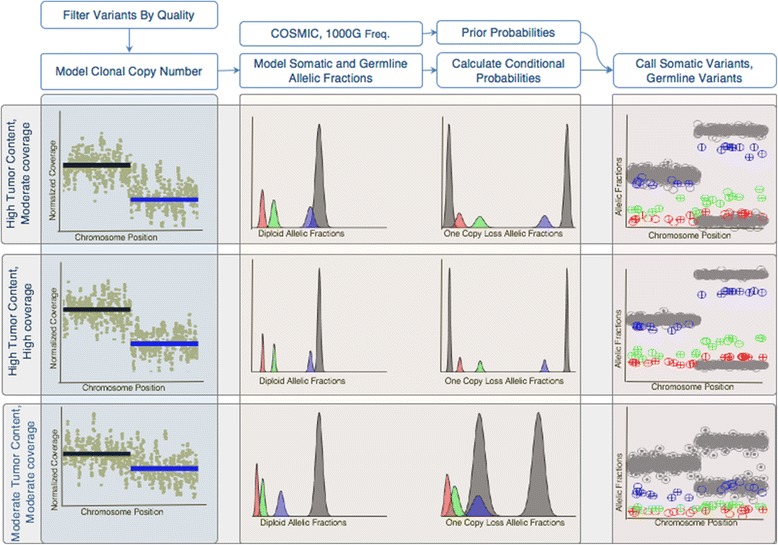
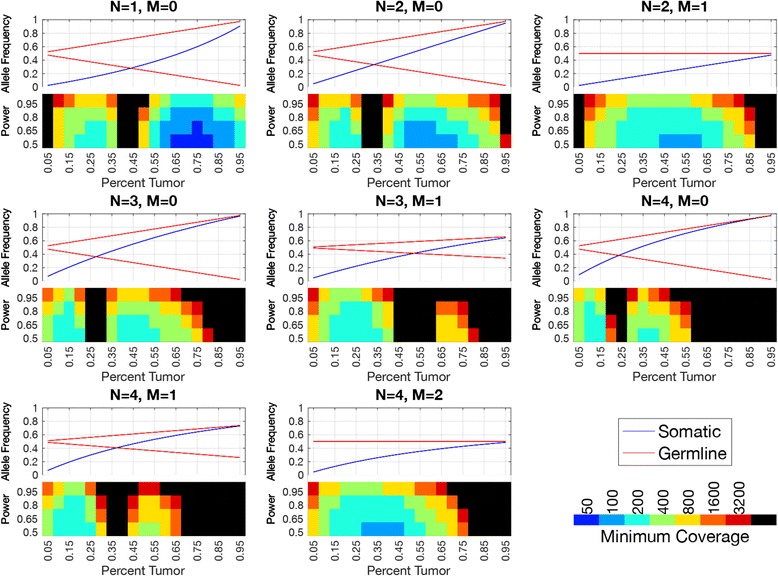
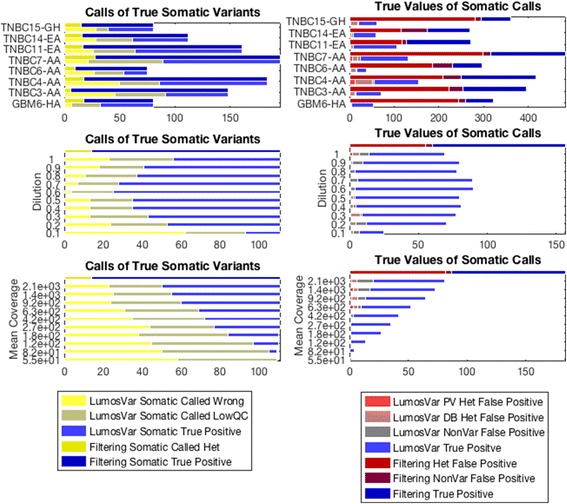
Methods: First, we examined the relationship between the germline false positives and ancestry. Then we developed and implemented a tumor only caller (LumosVar) that leverages differences in allelic frequency between somatic and germline variants in impure tumors. We used simulated data to systematically examine how copy number alterations, tumor purity, and sequencing depth should affect the sensitivity of our caller. Finally, we evaluated the caller on real data.

Results: We find the germline false-positive rate is significantly higher for individuals of non-European Ancestry largely due to the limited diversity in public polymorphism databases and due to population-specific characteristics such as admixture or recent expansions. Our Bayesian tumor only caller (LumosVar) is able to greatly reduce false positives from private germline variants, and our sensitivity is similar to predictions based on simulated data.

Conclusions: Taken together, our results suggest that studies of individuals of non-European ancestry would most benefit from our approach. However, high sensitivity requires sufficiently impure tumors and adequate sequencing depth. Even in impure tumors, there are copy number alterations that result in germline and somatic variants having similar allele frequencies, limiting the sensitivity of the approach. We believe our approach could greatly improve the analysis of archival samples in a research setting where the normal is not available.

Keywords: Cancer; Copy number alterations; Germline variant; Next generation sequencing; Precision medicine; Somatic mutation; Tumor purity.


Conflict of interest statement

Ethics approval and consent to participate

Only already existing de-identified data and biospecimens (both whole-blood and “fresh-frozen” tumor) previously collected under IRB approved studies (WIRB #20100721; WIRB #20141201; and WIRB #20031485) were used for this research.

Consent for publication

Not applicable.

Competing interests

The authors declare that they have no competing interests.

Publisher’s Note

Springer Nature remains neutral with regard to jurisdictional claims in published maps and institutional affiliations.

Figures

Fig. 1
Fig. 1
Correlation between ancestry and the effectiveness of using database filters to identify somatic variants. a The distribution and number of variants unique to an individual across 2503 individual from Phase 3 of 1000 Genomes plotted as violin plot for each of 26 different populations (indicated by their 3 letter code), and colored based on their ancestral super population. b The number of private variants for 150 individuals after filtering through 1000 Genomes, ExAc. not previously sequenced shown by their principle components of common variation (>1%) is shown as a color-metric bubble chart. c The distribution of variants within the groups within the right PCA plot, correlating to sections in B, where individuals clustering near those of European, Asian, and African Ancestry
Fig. 2
Fig. 2
Overview of Variant Calling Strategy. After filtering candidate variant positions by quality, an EM approach is used to fit a model of clonal allelic copy number. The plots on the left show example copy number plots for three conditions, the top panel showing high tumor content and moderate coverage, the middle panels with high tumor content and high coverage, and the bottoms panel with moderate tumor content and moderate coverage. A one copy loss is detected in the segment indicated by the blue line in the first left-most column. Next the expected somatic and germline allelic fractions are modeled in subsequent column. The center two columns plots the expected allelic fractions for germline variants (grey), somatic main clone (blue), and somatic sub clonal (green and red) for diploid regions (left) and one copy loss regions (right). We can see that in high tumor content, moderate coverage, the main clone distribution overlaps with the germline and is difficult to detect in the diploid region, while the red sub-clone is more difficult to detect in the one copy loss region. Increasing the coverage increases sharpness of the distributions making the somatic variants easier to detect. In the moderate tumor content sample, all clones are easy to differentiate from germline in the diploid region, but the main clone is hard to detect in the one copy loss region. Using these distributions to calculate conditional probabilities, as well as using 1000 genomes population frequencies and COSMIC mutation counts to calculate prior probabilities, somatic and germline variants can be called. The right most columns show plots of the allelic fractions of germline (grey) and somatic variants colored by clone. In these, encircled ‘+’ indicates the variant was detected and empty “o” indicates a false negative. As expected, in the high tumor content moderate coverage condition, variants in the main clone are detected better in the deleted region, and the number of variants detected increases in the high coverage condition
Fig. 3
Fig. 3
Allele Frequencies of Somatic and Germline Variants and Required Coverage for Somatic Variant Detection by Simulation. The top half of each graph shows the expected allele frequency of somatic (blue) and germline variants (red) by tumor content (x-axis) for different copy number states (plot titles, N indicates total copy number, M indicates minor allele copy number). The bottom half of each graphs shows the coverage required (indicated by the color) to get the power indicated by the y-label. Black squares indicate that the detection power was not achieved even at the highest coverage evaluated. We can see that the closer the somatic and germline allele frequencies, the more difficult it is to detect somatic variants
Fig. 4
Fig. 4
Comparison of Calls of True Somatic Variants and True Values of Variants Called Somatic. The graphs on the left shows the calls of LumosVar (bottom bar in pair) compared to filtering approach (top bar in pair) in calling true somatic variants. The size of the yellow portions of the bars indicate the number of true somatic variants falsely called germline heterozygotes or homozygous, the grey represents true somatic variants that were filtered on quality or not detected as variants, and the blue represents true positive somatic calls. We can see that the filtering approach has better sensitivity (mean TPR 87%, range 78%–96%) compared to the tumor only caller (mean TPR 52%, range 27%–62%). The graphs on the right shows the number of somatic calls by the LumosVar (bottom bar in pair) compared to the filtering approach (top bar in pair) that are truly germline private heterozygous (red), germline heterozygous database variants (pink), homozygous (grey) or truly somatic (blue). We can see that the tumor only caller has better precision (mean PPV 75%, range 56%–89%) compared to the filtering approach (mean PPV 35%, range 19%–55%). The top pair of panels shows the comparison for eight of the nine evaluation samples. The middle of panels shows the comparison for an in-silico dilution series preformed using the ninth evaluation sample (GBMEA1), while the bottom panel shows a down-sampling experiment on the same sample
Fig. 5
Fig. 5
Simulations were used to predict the power to detect each true somatic variant assuming the sample fraction and copy number were correctly called. For each clone and each sample, the true positive rate is plotted against the power predicted from the simulations. The size of the bubble is proportional to the number of true positive variants in each clone, the color the points represents the sample fraction of the clone, and the number indicates the sample number. As expected, the highest sample fraction clone has the worse predicted and observed sensitivity. The graph on the left includes all of the true somatic variants, and the graph on the right only includes those that pass the quality filters. We can see that the predicted power correlates well with the measured sensitivity, particularly when the low quality variants are excluded

References

    1. Raymond VM, Gray SW, Roychowdhury S, Joffe S, Chinnaiyan AM, Parsons DW, et al. Germline findings in tumor-only sequencing: points to consider for clinicians and laboratories. J Natl Cancer Inst. 2016;108:djv351. doi: 10.1093/jnci/djv351. - DOI - PMC - PubMed
    1. Jones S, Anagnostou V, Lytle K, Parpart-Li S, Nesselbush M, Riley DR, et al. Personalized genomic analyses for cancer mutation discovery and interpretation. Sci Transl Med. 2015;7:283ra53. doi: 10.1126/scitranslmed.aaa7161. - DOI - PMC - PubMed
    1. Garofalo A, Sholl L, Reardon B, Taylor-Weiner A, Amin-Mansour A, Miao D, et al. The impact of tumor profiling approaches and genomic data strategies for cancer precision medicine. Genome Med. 2016;8:79. doi: 10.1186/s13073-016-0333-9. - DOI - PMC - PubMed
    1. Smith KS, Yadav VK, Pei S, Pollyea DA, Jordan CT, De S. SomVarIUS: somatic variant identification from unpaired tissue samples. Bioinformatics. 2015;2015:btv685. - PubMed
    1. Consortium T. 1000 GP. An integrated map of genetic variation from 1,092 human genomes. Nature. 2012;491:56–65. doi: 10.1038/nature11632. - DOI - PMC - PubMed

Publication types