. 2017 Oct 18;550(7676):388-392.
doi: 10.1038/nature23885.

Social behaviour shapes hypothalamic neural ensemble representations of conspecific sex

Affiliations

Social behaviour shapes hypothalamic neural ensemble representations of conspecific sex

Ryan Remedios et al. Nature. .

Abstract

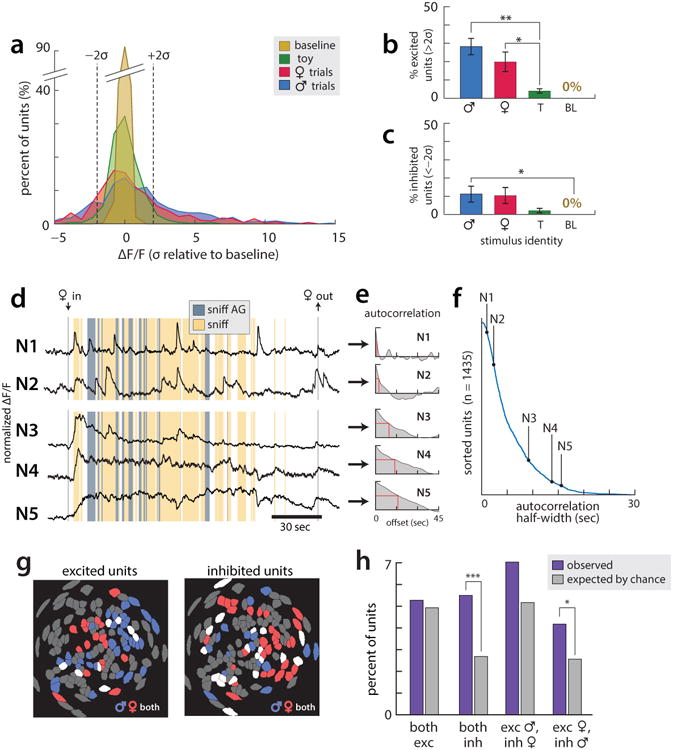
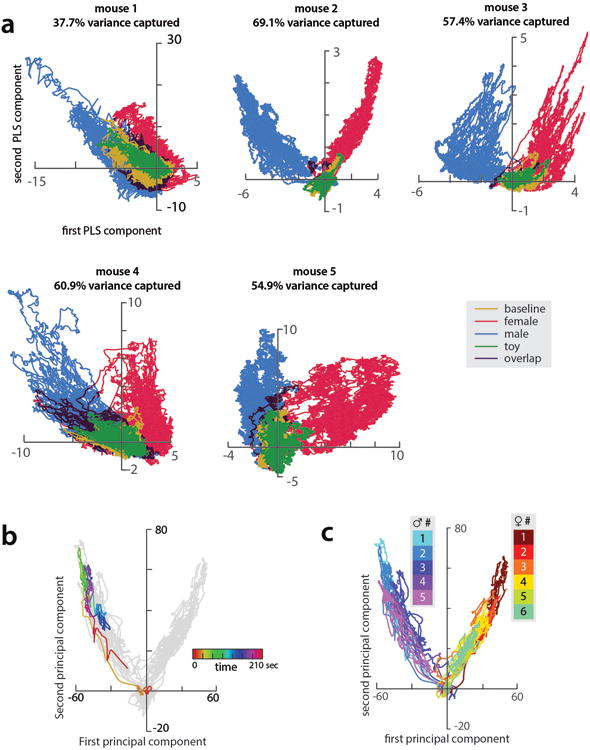
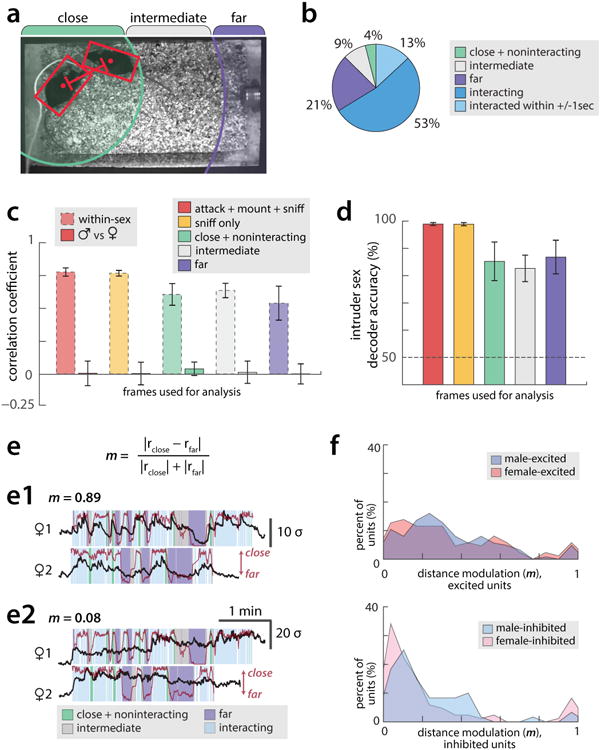
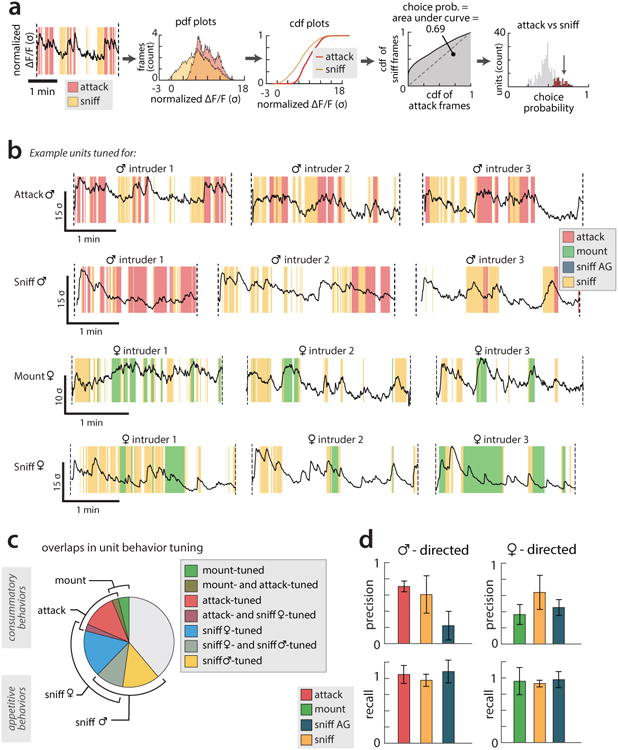
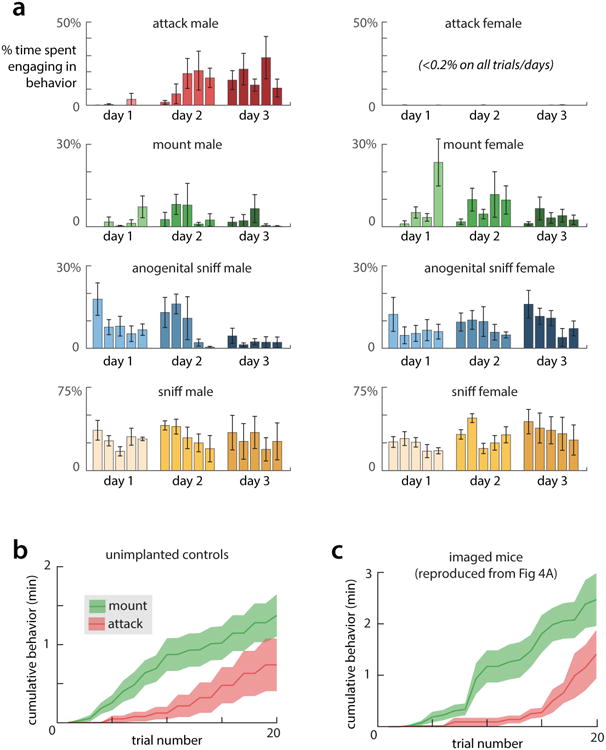
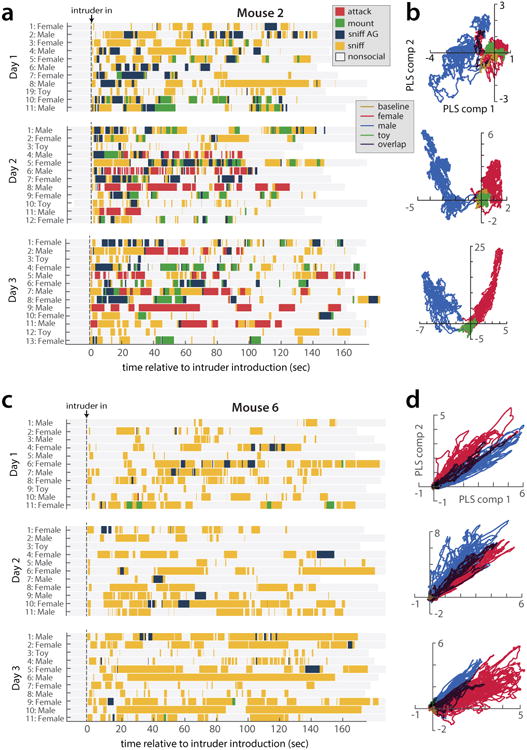
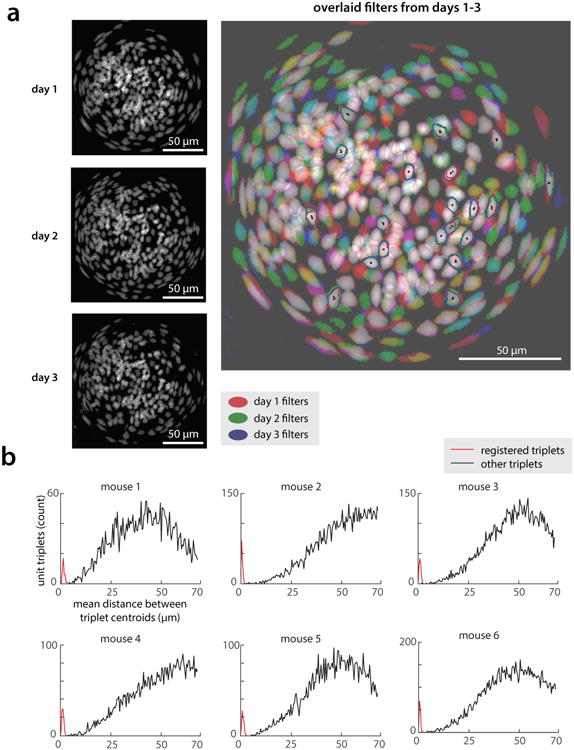
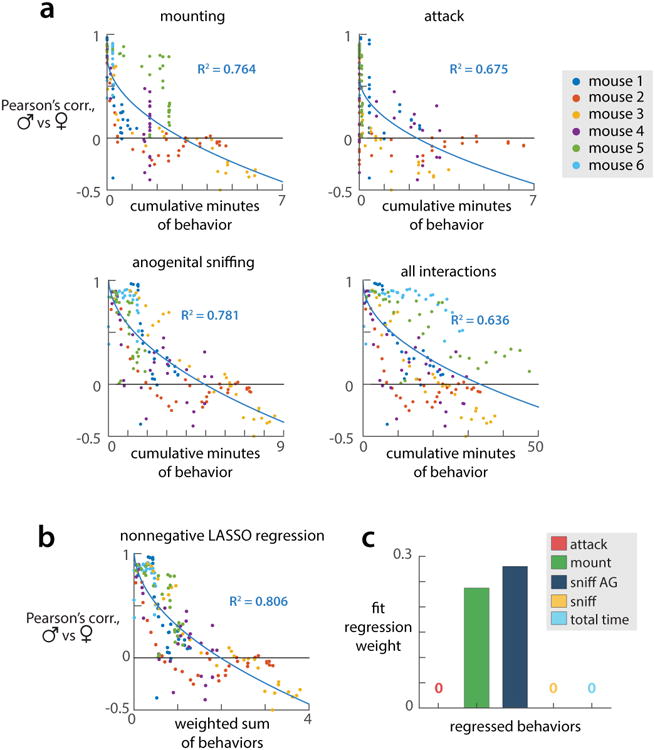
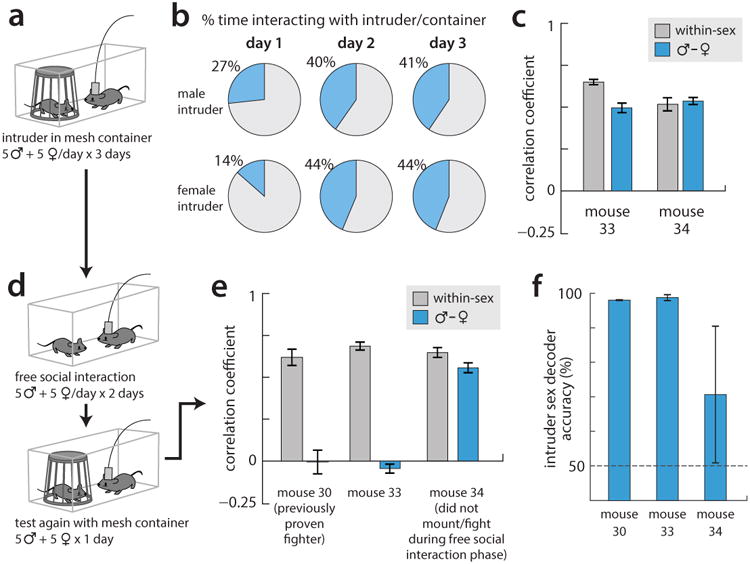
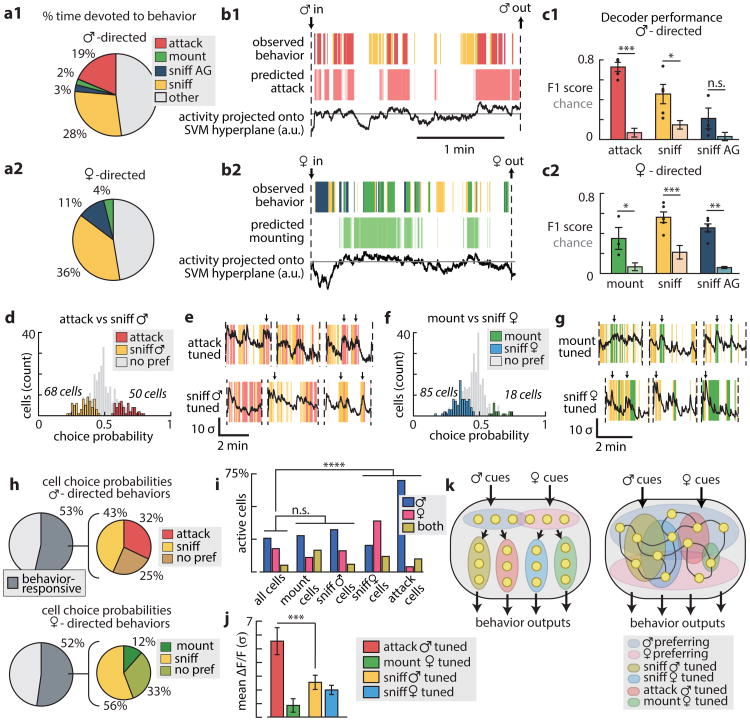
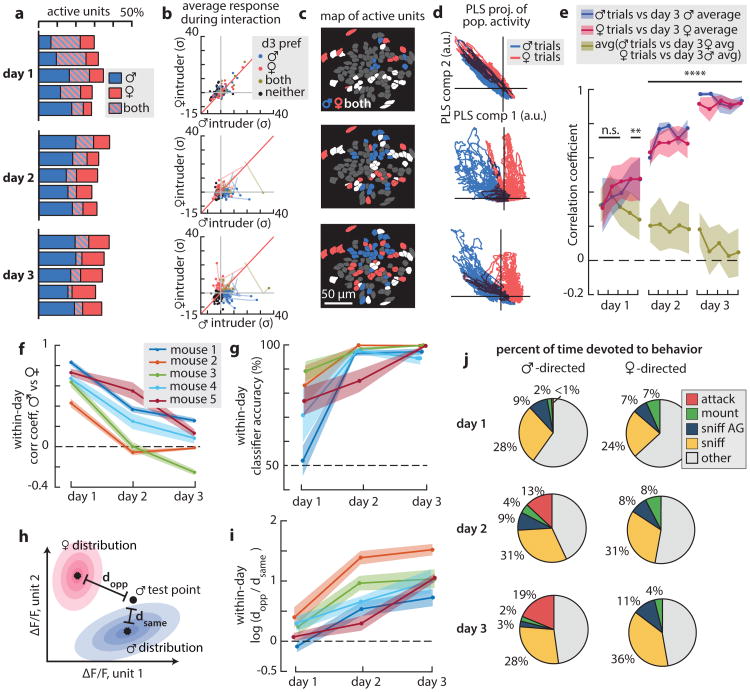
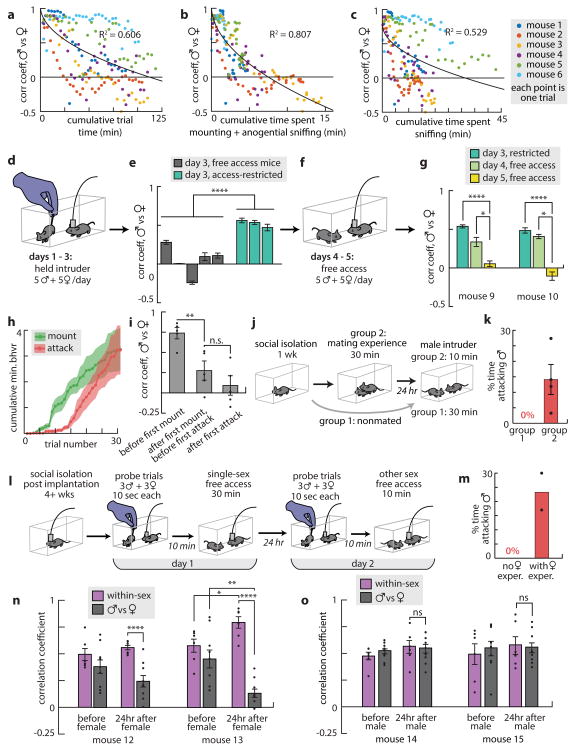
All animals possess a repertoire of innate (or instinctive) behaviours, which can be performed without training. Whether such behaviours are mediated by anatomically distinct and/or genetically specified neural pathways remains unknown. Here we report that neural representations within the mouse hypothalamus, that underlie innate social behaviours, are shaped by social experience. Oestrogen receptor 1-expressing (Esr1+) neurons in the ventrolateral subdivision of the ventromedial hypothalamus (VMHvl) control mating and fighting in rodents. We used microendoscopy to image Esr1+ neuronal activity in the VMHvl of male mice engaged in these social behaviours. In sexually and socially experienced adult males, divergent and characteristic neural ensembles represented male versus female conspecifics. However, in inexperienced adult males, male and female intruders activated overlapping neuronal populations. Sex-specific neuronal ensembles gradually separated as the mice acquired social and sexual experience. In mice permitted to investigate but not to mount or attack conspecifics, ensemble divergence did not occur. However, 30 minutes of sexual experience with a female was sufficient to promote the separation of male and female ensembles and to induce an attack response 24 h later. These observations uncover an unexpected social experience-dependent component to the formation of hypothalamic neural assemblies controlling innate social behaviours. More generally, they reveal plasticity and dynamic coding in an evolutionarily ancient deep subcortical structure that is traditionally viewed as a 'hard-wired' system.


Figures

Extended Data 1
Extended Data 1. Properties of Esr1+ neuron responses
All data presented is from the third day of imaging. (a) Histogram of time-averaged ΔF(t)/F0 values observed in the 30 seconds following stimulus introduction (or the first 30 seconds of imaging, on baseline trials). Dashed lines indicate thresholds for identifying excited ≥2 standard deviations (σ) of baseline above the mean pre-intruder baseline) and inhibited (≤−2σ below pre-intruder baseline) cells. (N=5 imaged mice, 5 male trials/5 female trials/2 toy trials/2 baseline trials per mouse.) (b-c) Average percent of time cells spend excited (b) or inhibited (c) in first 30 seconds of imaging. (d) Example traces from single Esr1+ cells, showing example response profiles across a single trial of interactions with a female conspecific. While some cells showed transient calcium responses (N1-N2), others showed slower dynamics (N3-N5), including persistent elevation or suppression of activity for the duration of the encounter with the female. We believe the latter responses to reflect the ongoing activity of some VMHvl cells, as filtered by the slow dynamics of GCaMP6s. (e) Autocorrelation functions computed across all day 3 trials, for each example cell in (d); red line indicates half-width. (f) Autocorrelation half-width computed across all day 3 trials, for all cells from the third day of imaging in all mice (N=1435 cells in 5 mice), sorted from smallest to largest, revealing a continuous range of values. Autocorrelations of the five cells in (d) are indicated. (g) Example spatial maps of excited (Left; mean ΔF(t)/F0 ≥2σ during periods of social interaction) and inhibited (Right; mean ΔF(t)/F0 ≤−2σ during interaction across all male and female trials on the third day of imaging) cells in the presence of male and female conspecifics. (h) The percentage of cells across all mice (N=5) that were excited and/or inhibited by both males and females, compared to the percentage expected by chance assuming statistical independence. (both inh, p=2.17e-4; exc female + inh male, p=0.0299)
Extended Data 2
Extended Data 2. Representations of males and females in PC-space in all mice
(a) Day 3 ensemble representations of intruder sex for the five mice that mounted and fought with conspecifics, projected onto the first two PLS axes. Traces are colored by intruder sex identity. Percent variance explained by the first two PLS components is noted for each mouse. (b) Projection of a single trial onto first 2 principal axes of one example mouse (mouse 2), color-coded to highlight temporal trajectory of the ensemble representation during the trial. Principal axes were identified using PCA (same axes as in Figure 1K.) (c) All trials from mouse 2, colored by trial number.
Extended Data 3
Extended Data 3. Distance dependence of intruder sex representations
(a) Example video frame showing estimates of resident and intruder poses and centroids (red bounding boxes and points, respectively), produced by an automated tracker (Dollar et al.). Green, gray, and purple bars mark the inter-mouse distances (relative to the resident) categorized as close, intermediate, and far. (b) Proportion of time animals spent either interacting with conspecifics or present within the three zones. Timepoints in which animals have recently interacted (ie interaction occurs within ±1 s) are shown as their own category as a control for the effect of GCaMP smoothing on transient representations. (c) Pearson's correlation coefficient within trials of the same intruder sex, or between male and female trials, where representations of intruders are computed by averaging each cell's ΔF(t)/F0 across the indicated subsets of imaging timepoints. (d) Accuracy of a linear SVM decoder for intruder sex, using representations computed as in (c). (e) The distance modulation index (m), a measure of the extent to which cell activity is modulated by inter-animal distance, is computed from rclose –the average response of a cell when animals are close but have not recently interacted (within ±1 sec), and rfar –the average response of that cell when animals are far apart and have not recently interacted. (e1-e2) Example traces from two cells that have a high (e1, m = 0.89) and low (e2, m = 0.08) distance modulation index. (f) Histograms of values of m observed in all cells that are significantly excited (Above) or inhibited (Below) during interaction with males or females. Note that inhibited cells are less sensitive to inter-animal distance than are excited cells, and that the distribution of m is similar for male- and female- responsive cells.
Extended Data 4
Extended Data 4. Choice probability histograms and example cells
(a) Steps for computing choice probability (CP), a measure of the discriminability of two conditions, given the ΔF(t)/F0 of a single cell. For a given pair of behaviours (here, male-directed attack and sniffing), we find the distribution of ΔF(t)/F0 values for this cell for each behaviour and compute the cumulative distribution function (cdf). The area under the receiver operating characteristic (ROC) curve formed from these two distributions is defined as the cell's choice probability. (b) ΔF/F traces and corresponding behavior rasters from example cells that showed significant CPs for the specified behavior, illustrating the relative changes in ΔF/F and behavior. Three representative trials are shown (same examples as in Figure 2 d-g). (c) Proportion of cells significantly tuned for each examined behavior. Overlap between blocks reflects the proportion of cells that were significantly tuned for both behaviors. Note that cells cannot be tuned for both attack and male-directed sniffing, nor for both mounting and female-directed sniffing, as cells' CP is defined by comparing ΔF(t)/F0 values under these paired conditions. All cells significantly tuned for attack, mount or sniff also showed a significant CP for periods of close social interactions (CSI, including sniffing and/or mount or attack) vs. periods of non-social interactions, by construction. However some cells that showed a significant CP for CSI vs. non-social periods did not show a significant CP for a specific behavior (see Fig. 2h). (d) Separate precision (true positives / (true positives + false positives)) and recall (true positives / (true positives + false negatives)) scores for the behavior decoders presented in Fig. 2b-c. The F1-score (presented in Fig. 2c) is defined as 2*(precision * recall) / (precision + recall).
Extended Data 5
Extended Data 5. Expression of social behaviors across trials and days
(a) Percent of time mice spent engaging in male- and female-directed behaviors on each of five trials on three days of imaging. (n=5 mice, mean ±s.e.m.) (b) Cumulative time spend mounting and attacking by a set of unoperated, socially isolated mice that underwent two days of the standard social experience paradigm depicted in Fig. 1d (n=8 mice). The unoperated mice exhibit a delay in the appearance of mounting, and show mounting before attack, indicating that changes in behavior are not due to effects of surgery or the presence of the scope. (c) Comparable data for implanted mice (n=5), reproduced from Figure 3g and restricted to the first 20 trials for comparison.
Extended Data 6
Extended Data 6. Comparison of the social behaviors and neural representations in example mice that did and did not show aggression
(a, c) Behavior rasters and (b, d) first two PLS components from example mice that did (a, b) and did not (c, d) show aggression to conspecific males by the third day of imaging.
Extended Data 7
Extended Data 7. Registration of cells across three days of imaging
(a) (Left) Maximum projection maps of all spatial filters from each of three days of imaging in an example mouse. (Right) RGB composite image of the three left images (day 1 = red channel, day 2 = green channel, day 3 = blue channel), showing overlap of registered filters (overlap in all three channels appears in white). Outlined are 20 example cells (out of 135) that could be identified in all three days of imaging: red/green/blue lines indicate filter outlines on first/second/third day, respectively; black points mark filter centroids. (b) Histograms of average distance between filter centroids from days 1-3, in cells that could be tracked across days (red) as compared to random triplets of cells (black). Day 1-3 centroids from tracked cells were separated by an average of 2.15±0.06 microns (mean ± s.e.m., n = 593 cells tracked across days in 6 mice, during standard RI assay).
Extended Data 8
Extended Data 8. Preference changes of Esr1+ neurons during the acquisition of social experience
(a) Table comparing responses on day 1 trial 1 to active cells on day 3, for all mice and all cells that were registered across three days of imaging (n=455 cells analyzed in the 5 mice that showed attack/mounting by day 3 of the standard RI assay). (b) Upper, response properties of cells on day 3, conditioned on their responses on day 1 trial 1, grouped according to the response types on trial 1. For example, among cells that responded to both males and females on day 1 trial 1, ∼26% (20/78) specifically responded to males on day 3, ∼26% responded specifically to females; additionally, ∼35% responded to neither sex and ∼13% responded to both. The percentages of these categories are summarized in panels (c). (b) Lower, response properties of cells on day 1 trial 1 conditioned on their response properties on day 3, grouped according to response types on day 3. The percentages in different categories are summarized in panel (d). For example, of the cells that showed male-specific responses on day 3, ∼54% derived from cells that responded to neither sex on day 1 trial 1; 20% derived from cells that responded to both sexes, 10% derived from initially female-specific cells and 16% derived from initially male specific cells. Numbers used to calculate the percentages are from the table in (a). (e) Analysis of the day 1 preferences of cells that responded only to males or only to females on day 3.
Extended Data 9
Extended Data 9. Behavior correlation with male/female similarity
(a) Cumulative minutes of each behavior by the nth trial plotted against the PCC between male and female representations on that trial, for 5 mice (behaviors already presented in Fig 4A-C have been omitted). All trials from a given mouse are shown in the same color. Solid lines are square root fits (of the form Y = m sqrt(X) + b) of the plotted points from all mice. (b) A weighted sum of cumulative minutes of each recorded behavior (attack, mounting, anogenital sniffing, and other sniffing) as well as cumulative time spent interacting with conspecifics, plotted against PCC between male and female representations; weights fit via nonnegative LASSO regression. (c) Bar plot of weights used to generate plot in (b), fit via nonnegative LASSO with sparseness parameter chosen to minimize mean-squared error on held-out data (see Methods).
Extended Data 10
Extended Data 10. Restricted access using a mesh container
To avoid the possibility that the lack of representation separation found in Fig. 4m-p was due to the presence of the experimenter's hand during access-restricted trials, we repeated this experiment with the intruder mouse instead kept within a wire mesh container. (a) Diagram of experimental setup. (b) Percent time the imaged mouse spent interacting with the intruder on each of the three days of exposure (n=2 mice). Aside from day 1, the presence of the container does not reduce the time the resident spent investigating the intruder mouse. (c) Pearson's correlation coefficient (PCC) between male and female representations on the third day of the assay (blue bars) shows that little separation of representations has occurred in the two imaged mice. Gray bars show the average PCC between pairs of male trials or pairs of female trials, for comparison. (d) Following the three days of intruder + container presentations, mice were given two days of free social interaction, before a final day (day 6) in which intruders were again presented within the mesh container. A third, experienced animal (mouse 30) was also tested with the mesh container. (e) PCC between representations of males and females presented within the mesh container on day 6; gray bars again show average PCC between pairs of male trials or pairs of female trials. Two out of three tested mice showed clear separation of male and female representations; the third did not, but this mouse also failed to fight or mate with conspecifics during the free social interaction. (f) Performance of an SVM decoder trained to predict intruder sex from the data on day 6, showing high accuracy in the two mice that had previously fought and mounted.
Figure 1
Figure 1. VMHvl Esr1+ neurons represent intruder sex
a, Schematic of preparation. Redrawn from Allen Mouse Brain Atlas, version 1 (2008). b, Approximate imaging plane (dashed line). c, sample frame showing active neurons. d, Experimental design. e, f, sample videoframes and ΔF/F traces. g, Raster of single cell responses (n=135 cells) ranked by response strength. h, PCC between cell responses to males and females. i, Spatial maps of averaged neuronal responses (top); sex-preferring cells (>2σ above baseline; bottom left); scatterplot of response intensities (lower right). j, Fraction of cells activated or inhibited (±2σ from baseline) by conspecifics for 10 trials (N=5 mice, 2,379 cells imaged). k, Population activity vectors in PC space estimated by PLS. l, Decoder performance following introduction of intruder (5 mice, 10 trials each). Panels e-g, i, k are from one example mouse. Center values in this and all figures are means±s.e.m.
Figure 2
Figure 2. Population activity predicts social behaviour
a1, a2, Behavioral responses to males and females (n=5 mice; AG, anogenital). b1, b2, Example decoder accuracy. c1,c2, Decoder performance (5 mice, 10 trials each; see Methods for significance testing). d, CPs of 291 neurons, with traces from two example neurons (e) during male interactions. f, CPs for the same 291 neurons during female interactions, with two example neurons (g). h, Summary of CP values. i, Proportion of sex-preferring cells (χ2 test, 3 d.o.f.). j, Response strength of tuned fractions (corrected for multiple comparisons). k, Two models of ensemble representations of behavior. In this and all figures, *, p<.05; **, p<.01; ***, p<.001, n.s., not significant (two-sided t-tests unless specified). Actual P-values for all figures provided in SI Table I.
Figure 3
Figure 3. Sex-specific ensembles emerge with experience
a-d, Ensemble representations change across three days of imaging. a, Fraction of responsive cells across pairs of consecutive trials (455 cells from 5 mice). b, Response strength (ΔF/F) for 135 cells identified across three days. c, Example spatial maps of intruder preference. d, Population vectors in PLS space. e, PCC between the trial-averaged ensemble responses on day 3 and each trial (points) for 5 mice. Significant ensemble separation commences on day 1 (post-hoc Bonferroni test corrected for multiple comparisons). f, Average PCC changes for each mouse. g, SVM decoder accuracy across days. h, Schematic description of Mahalanobis distance calculation. i, Changes in the Mahalanobis distance ratio. j, Fraction of time spent in social behaviours (N=5 mice).
Figure 4
Figure 4. Social experience promotes ensemble separation
a-c, PCC for the nth trial vs. cumulative social experience (a), cumulative mounting and anogenital sniffing (b) or cumulative body/face-directed sniffing (c). R2 values are for fit curve y = A√(x) + B (black). d, Illustration of “restricted-access” experiment. e, Ensemble separation for five mice with free access (gray) and three mice with restricted access (teal) were significantly different (one-way ANOVA). f,g, PCC decreased after two restricted-access mice received free access (day 4 and day 5; one-way ANOVA); day 3 bars duplicated from (e) to facilitate comparison. h, Cumulative time spent in behavior (n=5). i, Ensembles separate after mounting commences. j, Priming experiment. k, Males primed with females (group 2, n=4) attacked conspecific males; unprimed males (group 1, n=8) did not. l, Priming experiment adapted for imaging. m, Males primed with females fought. n, Mice primed with females (n=2) showed ensemble separation 24 hr later; Mice primed with males (n=2) did not (o).

Similar articles

Cited by

References

    1. Tinbergen N. The study of instinct. Clarendon Press; 1951.
    1. Lorenz K. On Aggression. Harcourt, Brace & World; 1966.
    1. Root CM, Denny CA, Hen R, Axel R. The participation of cortical amygdala in innate, odour-driven behaviour. Nature. 2014;515:269–273. doi: 10.1038/nature13897. - DOI - PMC - PubMed
    1. Newman SW. The medial extended amygdala in male reproductive behavior. A node in the mammalian social behavior network. Annals of the New York Academy of Sciences. 1999;877:242–257. - PubMed
    1. Veening JG, et al. Do similar neural systems subserve aggressive and sexual behaviour in male rats? Insights from c-Fos and pharmacological studies. European journal of pharmacology. 2005;526:226–239. doi: 10.1016/j.ejphar.2005.09.041. - DOI - PubMed

Publication types

Substances