

Geometagenomics illuminates the impact of agriculture on the distribution and prevalence of plant viruses at the ecosystem scale
- PMID: 29053145
- PMCID: PMC5739011
- DOI: 10.1038/ismej.2017.155
Geometagenomics illuminates the impact of agriculture on the distribution and prevalence of plant viruses at the ecosystem scale
Abstract
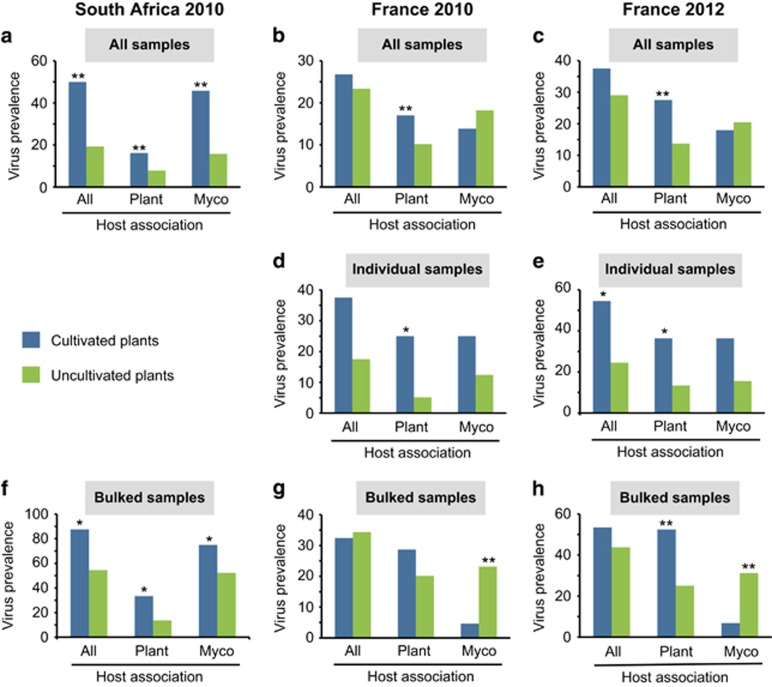
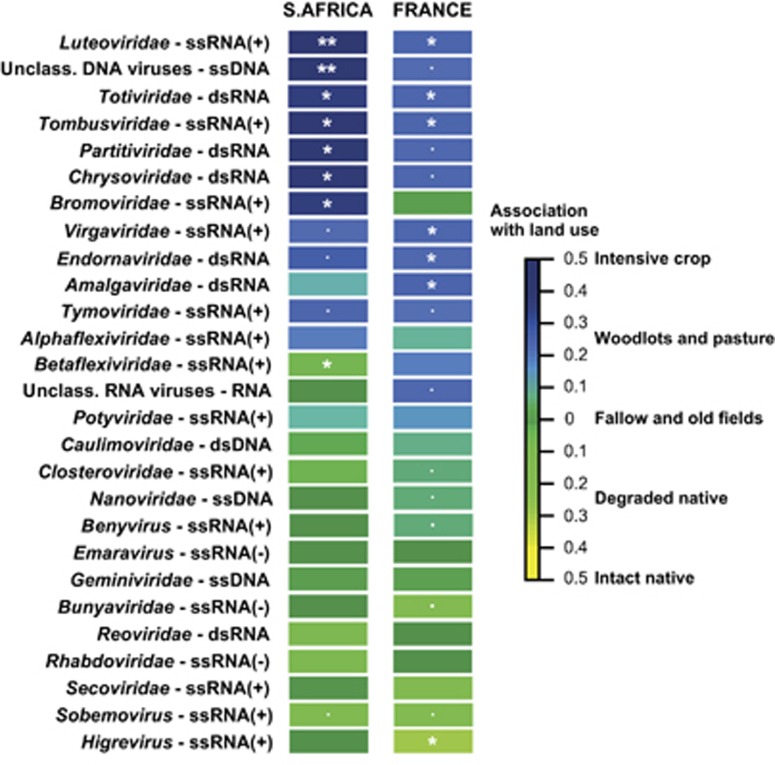
Disease emergence events regularly result from human activities such as agriculture, which frequently brings large populations of genetically uniform hosts into contact with potential pathogens. Although viruses cause nearly 50% of emerging plant diseases, there is little systematic information about virus distribution across agro-ecological interfaces and large gaps in understanding of virus diversity in nature. Here we applied a novel landscape-scale geometagenomics approach to examine relationships between agricultural land use and distributions of plant-associated viruses in two Mediterranean-climate biodiversity hotspots (Western Cape region of South Africa and Rhône river delta region of France). In total, we analysed 1725 geo-referenced plant samples collected over two years from 4.5 × 4.5 km2 grids spanning farmlands and adjacent uncultivated vegetation. We found substantial virus prevalence (25.8-35.7%) in all ecosystems, but prevalence and identified family-level virus diversity were greatest in cultivated areas, with some virus families displaying strong agricultural associations. Our survey revealed 94 previously unknown virus species, primarily from uncultivated plants. This is the first effort to systematically evaluate plant-associated viromes across broad agro-ecological interfaces. Our findings indicate that agriculture substantially influences plant virus distributions and highlight the extent of current ignorance about the diversity and roles of viruses in nature.
Conflict of interest statement
The authors declare no conflict of interest.
Figures

References
-
- Agrawal AA, Lau JA, Hamback PA. (2006). Community heterogeneity and the evolution of interactions between plants and insect herbivores. Q Rev Biol 81: 349–376. - PubMed
-
- Alexander HM, Mauck KE, Whitfield AE, Garrett KA, Malmstrom CM. (2014). Plant-virus interactions and the agro-ecological interface. Eur J Plant Pathol 138: 529–547.
-
- Allan BF, Keesing F, Ostfeld RS. (2003). Effect of forest fragmentation on Lyme disease risk. Conserv Biol 17: 267–272.
-
- Altschul SF, Gish W, Miller W, Myers EW, Lipman DJ. (1990). Basic local alignment search tool. J Mol Biol 215: 403–410. - PubMed
-
- Anderson PK, Cunningham AA, Patel NG, Morales FJ, Epstein PR, Daszak P. (2004). Emerging infectious diseases of plants: pathogen pollution, climate change and agrotechnology drivers. Trends Ecol Evol 19: 535–544. - PubMed
MeSH terms
LinkOut - more resources
Full Text Sources
Other Literature Sources
