. 2018 Jan;286(1):186-195.
doi: 10.1148/radiol.2017152877. Epub 2017 Oct 20.

What Are We Missing? False-Negative Cancers at Multiparametric MR Imaging of the Prostate

Affiliations

What Are We Missing? False-Negative Cancers at Multiparametric MR Imaging of the Prostate

Samuel Borofsky et al. Radiology. 2018 Jan.

Abstract

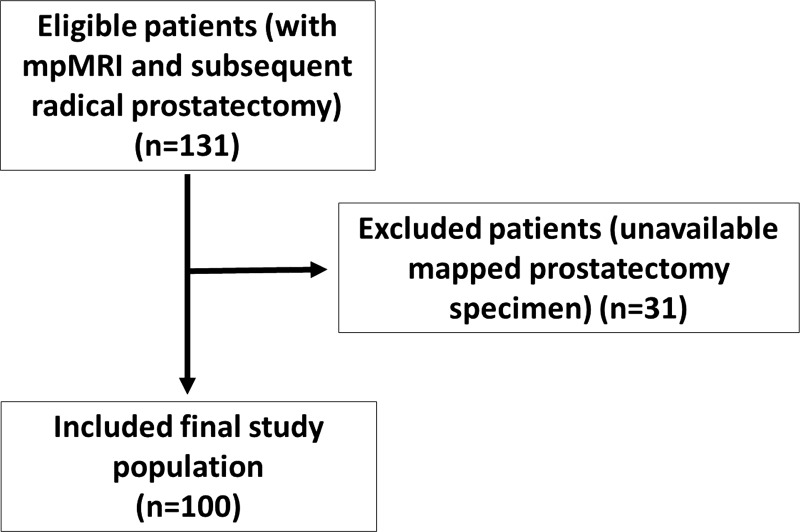
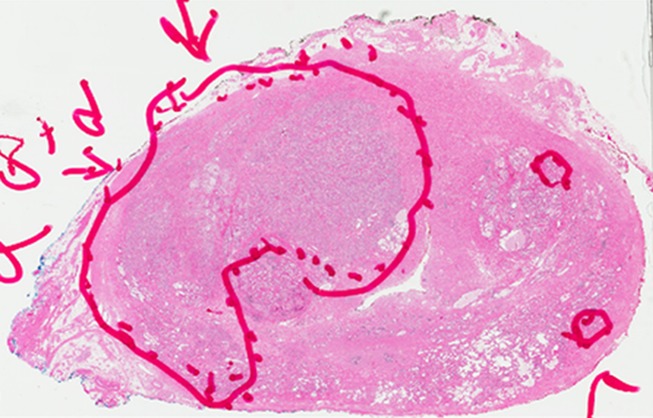
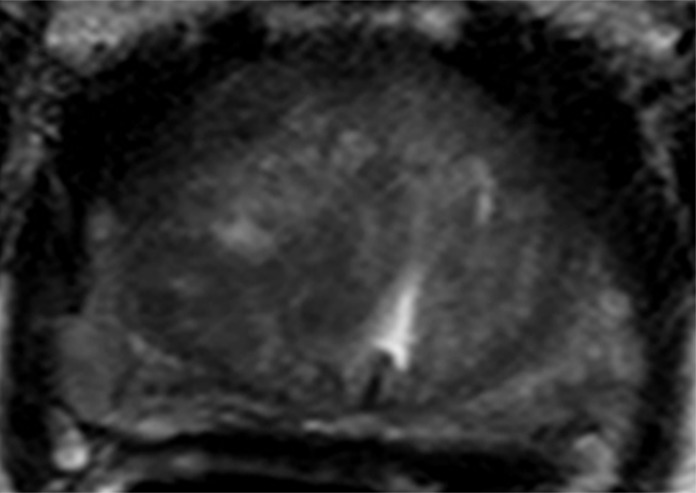
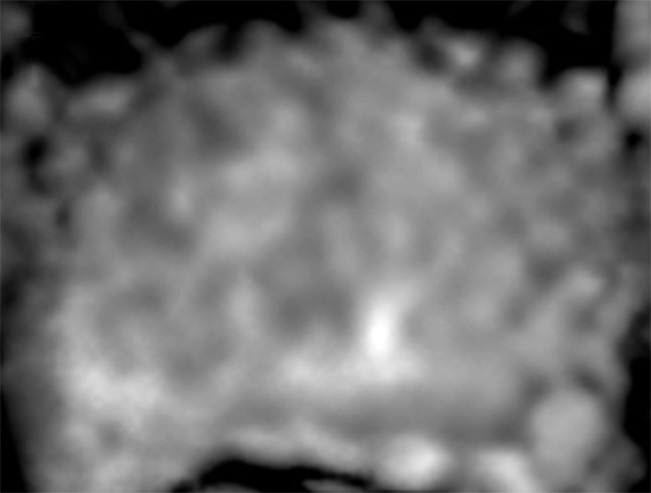
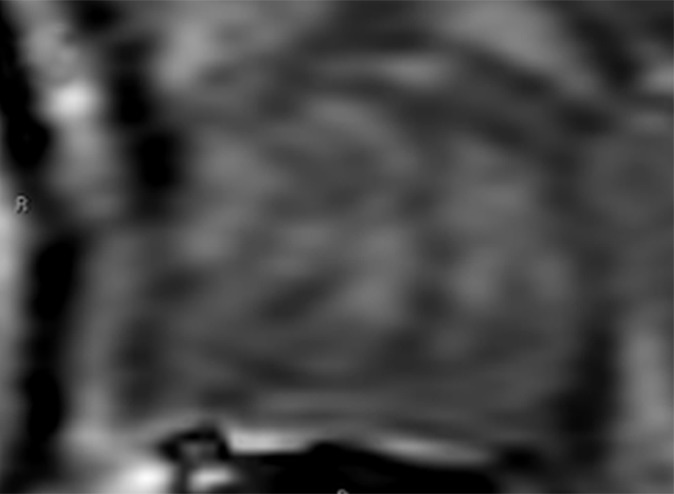
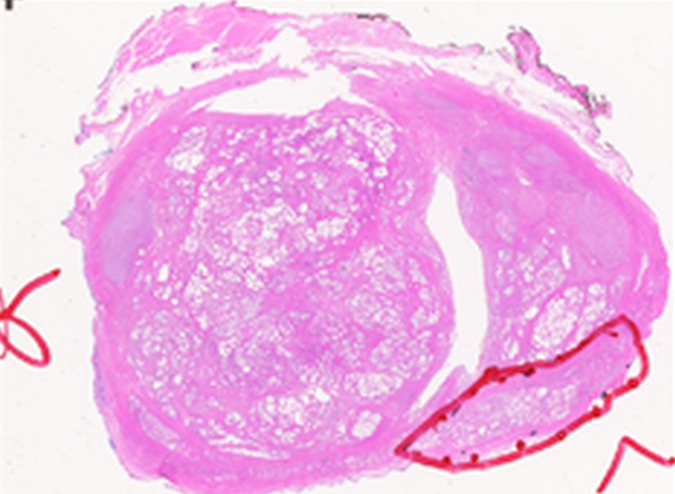
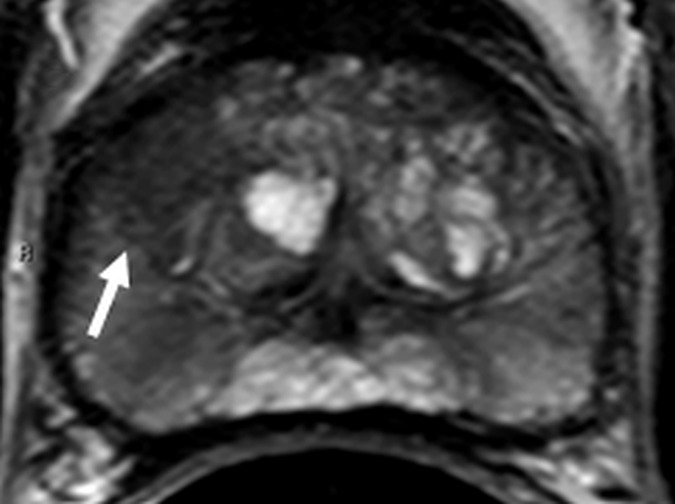
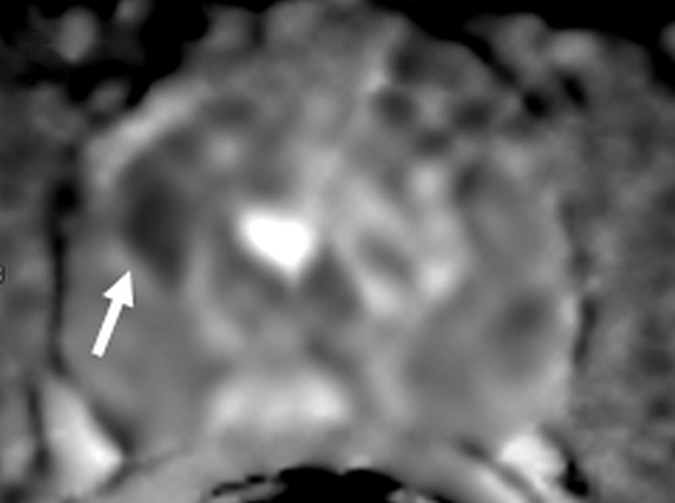
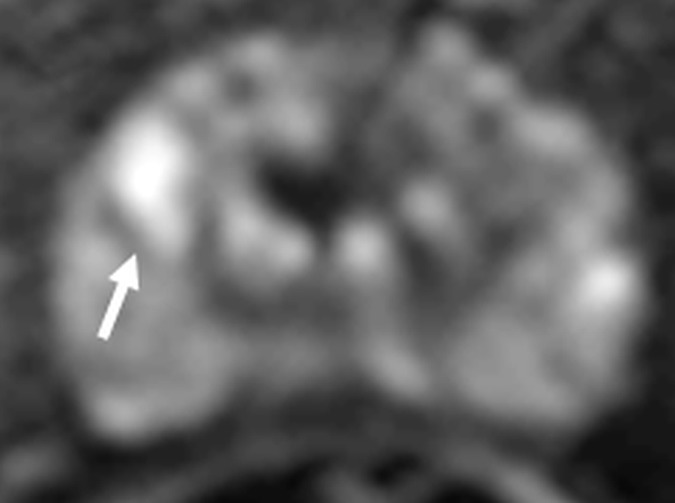
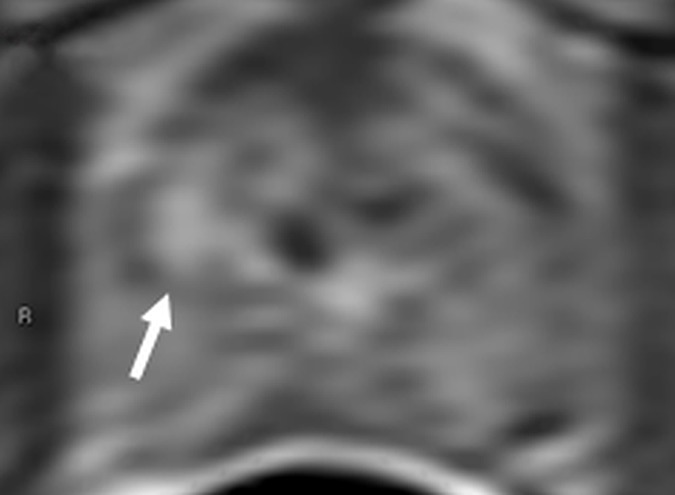
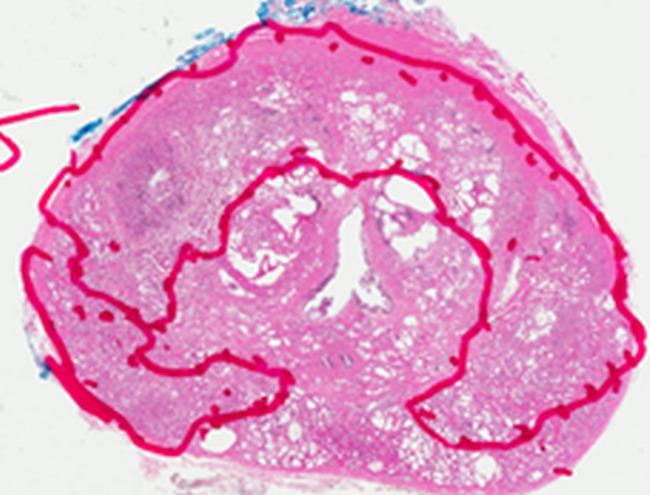
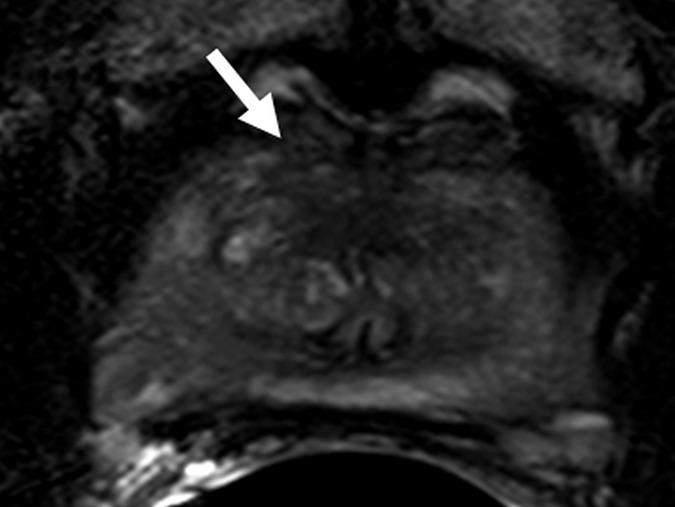
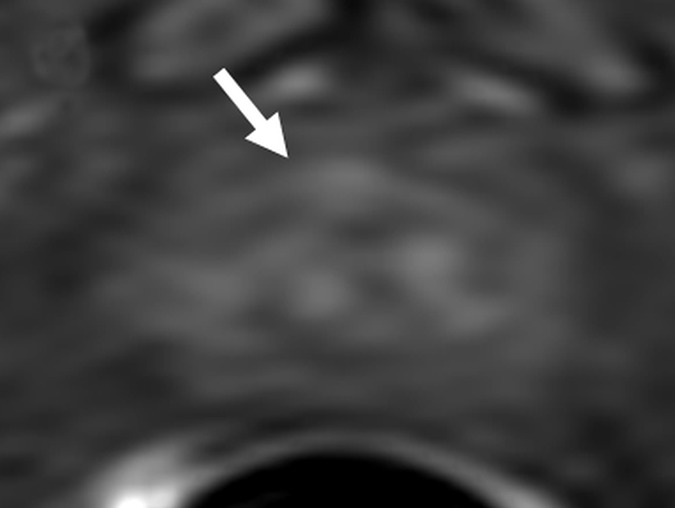
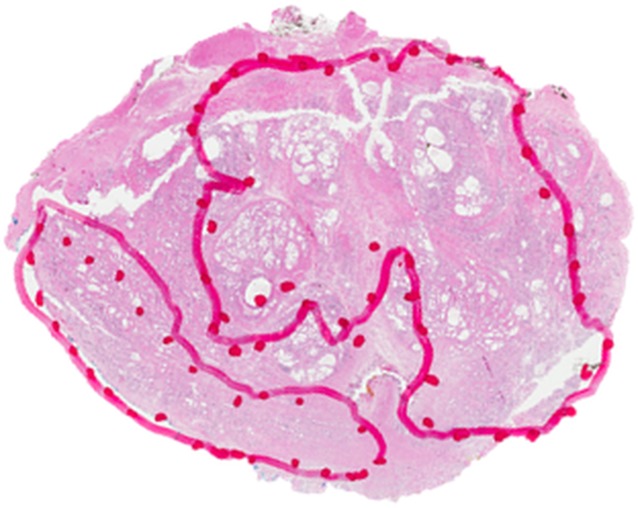
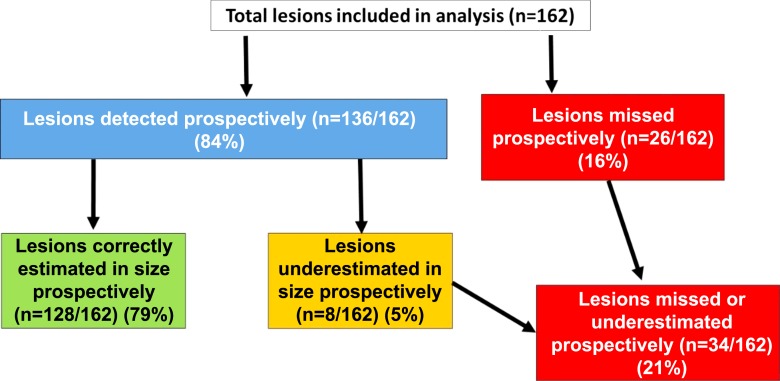
Purpose To characterize clinically important prostate cancers missed at multiparametric (MP) magnetic resonance (MR) imaging. Materials and Methods The local institutional review board approved this HIPAA-compliant retrospective single-center study, which included 100 consecutive patients who had undergone MP MR imaging and subsequent radical prostatectomy. A genitourinary pathologist blinded to MP MR findings outlined prostate cancers on whole-mount pathology slices. Two readers correlated mapped lesions with reports of prospectively read MP MR images. Readers were blinded to histopathology results during prospective reading. At histopathologic examination, 80 clinically unimportant lesions (<5 mm; Gleason score, 3+3) were excluded. The same two readers, who were not blinded to histopathologic findings, retrospectively reviewed cancers missed at MP MR imaging and assigned a Prostate Imaging Reporting and Data System (PI-RADS) version 2 score to better understand false-negative lesion characteristics. Descriptive statistics were used to define patient characteristics, including age, prostate-specific antigen (PSA) level, PSA density, race, digital rectal examination results, and biopsy results before MR imaging. Student t test was used to determine any demographic differences between patients with false-negative MP MR imaging findings and those with correct prospective identification of all lesions. Results Of the 162 lesions, 136 (84%) were correctly identified with MP MR imaging. Size of eight lesions was underestimated. Among the 26 (16%) lesions missed at MP MR imaging, Gleason score was 3+4 in 17 (65%), 4+3 in one (4%), 4+4 in seven (27%), and 4+5 in one (4%). Retrospective PI-RADS version 2 scores were assigned (PI-RADS 1, n = 8; PI-RADS 2, n = 7; PI-RADS 3, n = 6; and PI-RADS 4, n = 5). On a per-patient basis, MP MR imaging depicted clinically important prostate cancer in 99 of 100 patients. At least one clinically important tumor was missed in 26 (26%) patients, and lesion size was underestimated in eight (8%). Conclusion Clinically important lesions can be missed or their size can be underestimated at MP MR imaging. Of missed lesions, 58% were not seen or were characterized as benign findings at second-look analysis. Recognition of the limitations of MP MR imaging is important, and new approaches to reduce this false-negative rate are needed. © RSNA, 2017 Online supplemental material is available for this article.


Figures

Figure 1:
Figure 1:
Flowchart shows inclusion and exclusion criteria and the selection process used in this study.
Figure 2a:
Figure 2a:
Images in a 71-year-old patient with a history of previous negative transrectal US-guided biopsy and a serum PSA level of 16.09 ng/mL. (a) Axial T2-weighted MR image shows an area of low signal intensity in the right anterior transition zone (arrows). (b) Axial apparent diffusion coefficient (ADC) map obtained with DW MR imaging shows a hypointense lesion in this same location (arrows). (c) DW (b = 2000 sec/mm2 ) MR image shows this lesion (arrows) as a hyperintense focus. (d) Whole-mount pathologic specimen obtained at robotic-assisted prostatectomy shows Gleason 4+4 disease (red outline) in the same location. MP MR imaging correctly depicted the tumor and enabled us to estimate the tumor burden in this patient.
Figure 2b:
Figure 2b:
Images in a 71-year-old patient with a history of previous negative transrectal US-guided biopsy and a serum PSA level of 16.09 ng/mL. (a) Axial T2-weighted MR image shows an area of low signal intensity in the right anterior transition zone (arrows). (b) Axial apparent diffusion coefficient (ADC) map obtained with DW MR imaging shows a hypointense lesion in this same location (arrows). (c) DW (b = 2000 sec/mm2 ) MR image shows this lesion (arrows) as a hyperintense focus. (d) Whole-mount pathologic specimen obtained at robotic-assisted prostatectomy shows Gleason 4+4 disease (red outline) in the same location. MP MR imaging correctly depicted the tumor and enabled us to estimate the tumor burden in this patient.
Figure 2c:
Figure 2c:
Images in a 71-year-old patient with a history of previous negative transrectal US-guided biopsy and a serum PSA level of 16.09 ng/mL. (a) Axial T2-weighted MR image shows an area of low signal intensity in the right anterior transition zone (arrows). (b) Axial apparent diffusion coefficient (ADC) map obtained with DW MR imaging shows a hypointense lesion in this same location (arrows). (c) DW (b = 2000 sec/mm2 ) MR image shows this lesion (arrows) as a hyperintense focus. (d) Whole-mount pathologic specimen obtained at robotic-assisted prostatectomy shows Gleason 4+4 disease (red outline) in the same location. MP MR imaging correctly depicted the tumor and enabled us to estimate the tumor burden in this patient.
Figure 2d:
Figure 2d:
Images in a 71-year-old patient with a history of previous negative transrectal US-guided biopsy and a serum PSA level of 16.09 ng/mL. (a) Axial T2-weighted MR image shows an area of low signal intensity in the right anterior transition zone (arrows). (b) Axial apparent diffusion coefficient (ADC) map obtained with DW MR imaging shows a hypointense lesion in this same location (arrows). (c) DW (b = 2000 sec/mm2 ) MR image shows this lesion (arrows) as a hyperintense focus. (d) Whole-mount pathologic specimen obtained at robotic-assisted prostatectomy shows Gleason 4+4 disease (red outline) in the same location. MP MR imaging correctly depicted the tumor and enabled us to estimate the tumor burden in this patient.
Figure 3a:
Figure 3a:
Images in a 55-year-old patient with a history of previous transrectal US-guided prostate biopsy with Gleason 3+3 disease and a PSA level of 3.75 ng/mL. (a) Axial T2-weighted MR image, (b) axial ADC map obtained with DW MR imaging (b = 2000 sec/mm2 ), and (c, d) dynamic contrast-enhanced MR images do not show any clinically important abnormality. (e) Whole-mount pathologic specimen obtained at robotic-assisted prostatectomy shows Gleason 3+4 disease (red outline) in the left midperipheral zone. See also Movies 1–3 (online).
Figure 3b:
Figure 3b:
Images in a 55-year-old patient with a history of previous transrectal US-guided prostate biopsy with Gleason 3+3 disease and a PSA level of 3.75 ng/mL. (a) Axial T2-weighted MR image, (b) axial ADC map obtained with DW MR imaging (b = 2000 sec/mm2 ), and (c, d) dynamic contrast-enhanced MR images do not show any clinically important abnormality. (e) Whole-mount pathologic specimen obtained at robotic-assisted prostatectomy shows Gleason 3+4 disease (red outline) in the left midperipheral zone. See also Movies 1–3 (online).
Figure 3c:
Figure 3c:
Images in a 55-year-old patient with a history of previous transrectal US-guided prostate biopsy with Gleason 3+3 disease and a PSA level of 3.75 ng/mL. (a) Axial T2-weighted MR image, (b) axial ADC map obtained with DW MR imaging (b = 2000 sec/mm2 ), and (c, d) dynamic contrast-enhanced MR images do not show any clinically important abnormality. (e) Whole-mount pathologic specimen obtained at robotic-assisted prostatectomy shows Gleason 3+4 disease (red outline) in the left midperipheral zone. See also Movies 1–3 (online).
Figure 3d:
Figure 3d:
Images in a 55-year-old patient with a history of previous transrectal US-guided prostate biopsy with Gleason 3+3 disease and a PSA level of 3.75 ng/mL. (a) Axial T2-weighted MR image, (b) axial ADC map obtained with DW MR imaging (b = 2000 sec/mm2 ), and (c, d) dynamic contrast-enhanced MR images do not show any clinically important abnormality. (e) Whole-mount pathologic specimen obtained at robotic-assisted prostatectomy shows Gleason 3+4 disease (red outline) in the left midperipheral zone. See also Movies 1–3 (online).
Figure 3e:
Figure 3e:
Images in a 55-year-old patient with a history of previous transrectal US-guided prostate biopsy with Gleason 3+3 disease and a PSA level of 3.75 ng/mL. (a) Axial T2-weighted MR image, (b) axial ADC map obtained with DW MR imaging (b = 2000 sec/mm2 ), and (c, d) dynamic contrast-enhanced MR images do not show any clinically important abnormality. (e) Whole-mount pathologic specimen obtained at robotic-assisted prostatectomy shows Gleason 3+4 disease (red outline) in the left midperipheral zone. See also Movies 1–3 (online).
Figure 4a:
Figure 4a:
Images in a 55-year-old biopsy-naïve patient with a PSA level of 7.07 ng/mL. (a) Axial T2-weighted MR image shows an area of low signal intensity (arrow) in the right anterior transition zone. (b) Axial ADC map obtained reveals a hypointense lesion (arrow) in the same location. (c) DW MR image (b = 2000 sec/mm2 ) shows the lesion (arrow) as a hyperintense focus. (d) Dynamic contrast-enhanced MR image shows an early focal hyperenhancing lesion (arrow) in the right anterior transition zone. (e) Whole-mount pathologic specimen obtained at robotic-assisted prostatectomy shows Gleason 3+4 disease (red outline). The extent of the lesion is considerably larger than what was predicted at initial MR imaging.
Figure 4b:
Figure 4b:
Images in a 55-year-old biopsy-naïve patient with a PSA level of 7.07 ng/mL. (a) Axial T2-weighted MR image shows an area of low signal intensity (arrow) in the right anterior transition zone. (b) Axial ADC map obtained reveals a hypointense lesion (arrow) in the same location. (c) DW MR image (b = 2000 sec/mm2 ) shows the lesion (arrow) as a hyperintense focus. (d) Dynamic contrast-enhanced MR image shows an early focal hyperenhancing lesion (arrow) in the right anterior transition zone. (e) Whole-mount pathologic specimen obtained at robotic-assisted prostatectomy shows Gleason 3+4 disease (red outline). The extent of the lesion is considerably larger than what was predicted at initial MR imaging.
Figure 4c:
Figure 4c:
Images in a 55-year-old biopsy-naïve patient with a PSA level of 7.07 ng/mL. (a) Axial T2-weighted MR image shows an area of low signal intensity (arrow) in the right anterior transition zone. (b) Axial ADC map obtained reveals a hypointense lesion (arrow) in the same location. (c) DW MR image (b = 2000 sec/mm2 ) shows the lesion (arrow) as a hyperintense focus. (d) Dynamic contrast-enhanced MR image shows an early focal hyperenhancing lesion (arrow) in the right anterior transition zone. (e) Whole-mount pathologic specimen obtained at robotic-assisted prostatectomy shows Gleason 3+4 disease (red outline). The extent of the lesion is considerably larger than what was predicted at initial MR imaging.
Figure 4d:
Figure 4d:
Images in a 55-year-old biopsy-naïve patient with a PSA level of 7.07 ng/mL. (a) Axial T2-weighted MR image shows an area of low signal intensity (arrow) in the right anterior transition zone. (b) Axial ADC map obtained reveals a hypointense lesion (arrow) in the same location. (c) DW MR image (b = 2000 sec/mm2 ) shows the lesion (arrow) as a hyperintense focus. (d) Dynamic contrast-enhanced MR image shows an early focal hyperenhancing lesion (arrow) in the right anterior transition zone. (e) Whole-mount pathologic specimen obtained at robotic-assisted prostatectomy shows Gleason 3+4 disease (red outline). The extent of the lesion is considerably larger than what was predicted at initial MR imaging.
Figure 4e:
Figure 4e:
Images in a 55-year-old biopsy-naïve patient with a PSA level of 7.07 ng/mL. (a) Axial T2-weighted MR image shows an area of low signal intensity (arrow) in the right anterior transition zone. (b) Axial ADC map obtained reveals a hypointense lesion (arrow) in the same location. (c) DW MR image (b = 2000 sec/mm2 ) shows the lesion (arrow) as a hyperintense focus. (d) Dynamic contrast-enhanced MR image shows an early focal hyperenhancing lesion (arrow) in the right anterior transition zone. (e) Whole-mount pathologic specimen obtained at robotic-assisted prostatectomy shows Gleason 3+4 disease (red outline). The extent of the lesion is considerably larger than what was predicted at initial MR imaging.
Figure 5a:
Figure 5a:
Images in a 63-year-old biopsy-naïve patient with a PSA level of 6.25 ng/mL. (a) Axial T2-weighted MR image shows an area of low signal intensity (arrow) in the midline anterior transition zone. (b) Axial ADC map obtained with DW imaging reveals a hypointense lesion (arrow) in the same location. (c) DW MR image (b = 2000 sec/mm2 ) shows the lesion (arrow) as a mildly hyperintense focus. (d) Dynamic contrast-enhanced MR image shows corresponding mild focal hyperenhancement (arrow). (e) Whole-mount pathologic specimen obtained at robotic-assisted prostatectomy shows Gleason 4+4 disease corresponding to the identified lesion (red outline). However, the extent of the lesion was underestimated with MR imaging, particularly in the left transition zone. In addition, a Gleason 3+4 lesion was seen in the right peripheral zone (red outline). This lesion was not apparent at prospective or retrospective review (PI-RADS category 1). See also Movies E4–E6 (online).
Figure 5b:
Figure 5b:
Images in a 63-year-old biopsy-naïve patient with a PSA level of 6.25 ng/mL. (a) Axial T2-weighted MR image shows an area of low signal intensity (arrow) in the midline anterior transition zone. (b) Axial ADC map obtained with DW imaging reveals a hypointense lesion (arrow) in the same location. (c) DW MR image (b = 2000 sec/mm2 ) shows the lesion (arrow) as a mildly hyperintense focus. (d) Dynamic contrast-enhanced MR image shows corresponding mild focal hyperenhancement (arrow). (e) Whole-mount pathologic specimen obtained at robotic-assisted prostatectomy shows Gleason 4+4 disease corresponding to the identified lesion (red outline). However, the extent of the lesion was underestimated with MR imaging, particularly in the left transition zone. In addition, a Gleason 3+4 lesion was seen in the right peripheral zone (red outline). This lesion was not apparent at prospective or retrospective review (PI-RADS category 1). See also Movies E4–E6 (online).
Figure 5c:
Figure 5c:
Images in a 63-year-old biopsy-naïve patient with a PSA level of 6.25 ng/mL. (a) Axial T2-weighted MR image shows an area of low signal intensity (arrow) in the midline anterior transition zone. (b) Axial ADC map obtained with DW imaging reveals a hypointense lesion (arrow) in the same location. (c) DW MR image (b = 2000 sec/mm2 ) shows the lesion (arrow) as a mildly hyperintense focus. (d) Dynamic contrast-enhanced MR image shows corresponding mild focal hyperenhancement (arrow). (e) Whole-mount pathologic specimen obtained at robotic-assisted prostatectomy shows Gleason 4+4 disease corresponding to the identified lesion (red outline). However, the extent of the lesion was underestimated with MR imaging, particularly in the left transition zone. In addition, a Gleason 3+4 lesion was seen in the right peripheral zone (red outline). This lesion was not apparent at prospective or retrospective review (PI-RADS category 1). See also Movies E4–E6 (online).
Figure 5d:
Figure 5d:
Images in a 63-year-old biopsy-naïve patient with a PSA level of 6.25 ng/mL. (a) Axial T2-weighted MR image shows an area of low signal intensity (arrow) in the midline anterior transition zone. (b) Axial ADC map obtained with DW imaging reveals a hypointense lesion (arrow) in the same location. (c) DW MR image (b = 2000 sec/mm2 ) shows the lesion (arrow) as a mildly hyperintense focus. (d) Dynamic contrast-enhanced MR image shows corresponding mild focal hyperenhancement (arrow). (e) Whole-mount pathologic specimen obtained at robotic-assisted prostatectomy shows Gleason 4+4 disease corresponding to the identified lesion (red outline). However, the extent of the lesion was underestimated with MR imaging, particularly in the left transition zone. In addition, a Gleason 3+4 lesion was seen in the right peripheral zone (red outline). This lesion was not apparent at prospective or retrospective review (PI-RADS category 1). See also Movies E4–E6 (online).
Figure 5e:
Figure 5e:
Images in a 63-year-old biopsy-naïve patient with a PSA level of 6.25 ng/mL. (a) Axial T2-weighted MR image shows an area of low signal intensity (arrow) in the midline anterior transition zone. (b) Axial ADC map obtained with DW imaging reveals a hypointense lesion (arrow) in the same location. (c) DW MR image (b = 2000 sec/mm2 ) shows the lesion (arrow) as a mildly hyperintense focus. (d) Dynamic contrast-enhanced MR image shows corresponding mild focal hyperenhancement (arrow). (e) Whole-mount pathologic specimen obtained at robotic-assisted prostatectomy shows Gleason 4+4 disease corresponding to the identified lesion (red outline). However, the extent of the lesion was underestimated with MR imaging, particularly in the left transition zone. In addition, a Gleason 3+4 lesion was seen in the right peripheral zone (red outline). This lesion was not apparent at prospective or retrospective review (PI-RADS category 1). See also Movies E4–E6 (online).
Figure 6:
Figure 6:
Flowchart shows results of lesion-based analysis.

Comment in

References

    1. Damber JE, Aus G. Prostate cancer. Lancet 2008;371(9625):1710–1721. - PubMed
    1. Jemal A, Bray F, Center MM, Ferlay J, Ward E, Forman D. Global cancer statistics. CA Cancer J Clin 2011;61(2):69–90. - PubMed
    1. Fütterer JJ, Heijmink SW, Scheenen TW, et al. . Prostate cancer localization with dynamic contrast-enhanced MR imaging and proton MR spectroscopic imaging. Radiology 2006;241(2):449–458. - PubMed
    1. Haider MA, van der Kwast TH, Tanguay J, et al. . Combined T2-weighted and diffusion-weighted MRI for localization of prostate cancer. AJR Am J Roentgenol 2007;189(2):323–328. - PubMed
    1. Kitajima K, Kaji Y, Fukabori Y, Yoshida K, Suganuma N, Sugimura K. Prostate cancer detection with 3 T MRI: comparison of diffusion-weighted imaging and dynamic contrast-enhanced MRI in combination with T2-weighted imaging. J Magn Reson Imaging 2010;31(3):625–631. - PubMed

MeSH terms