

Contribution of Calpain and Caspases to Cell Death in Cultured Monkey RPE Cells
- PMID: 29053764
- PMCID: PMC6110128
- DOI: 10.1167/iovs.17-22325
Contribution of Calpain and Caspases to Cell Death in Cultured Monkey RPE Cells
Abstract
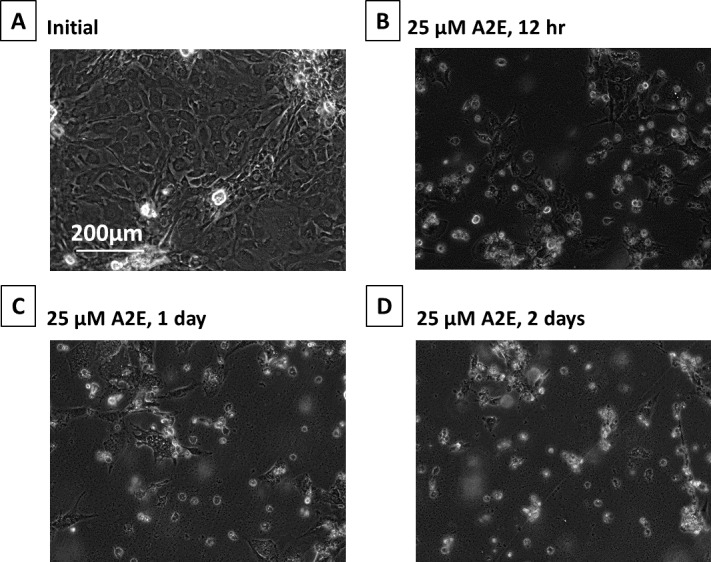
Purpose: AMD is the leading cause of human vision loss after 65 years of age. Several mechanisms have been proposed: (1) age-related failure of the choroidal vasculature leads to loss of RPE; (2) RPE dysfunctions due to accumulation of phagocytized, but unreleased A2E (N-retinylidene-N-retinylethanolamine); (3) zinc deficiency activation of calpain and caspase proteases, leading to cell death. The purpose of the present study is to compare activation of calpain and caspase in monkey RPE cells cultured under hypoxia or with A2E.
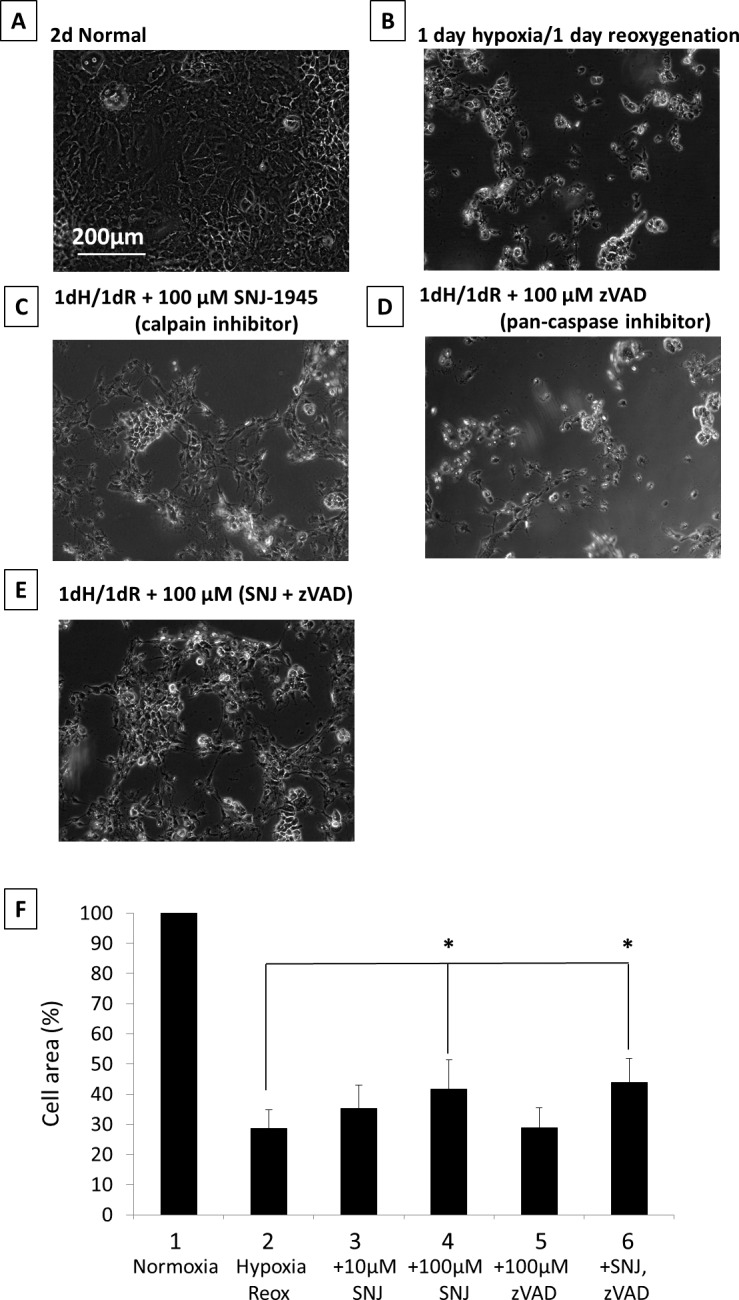
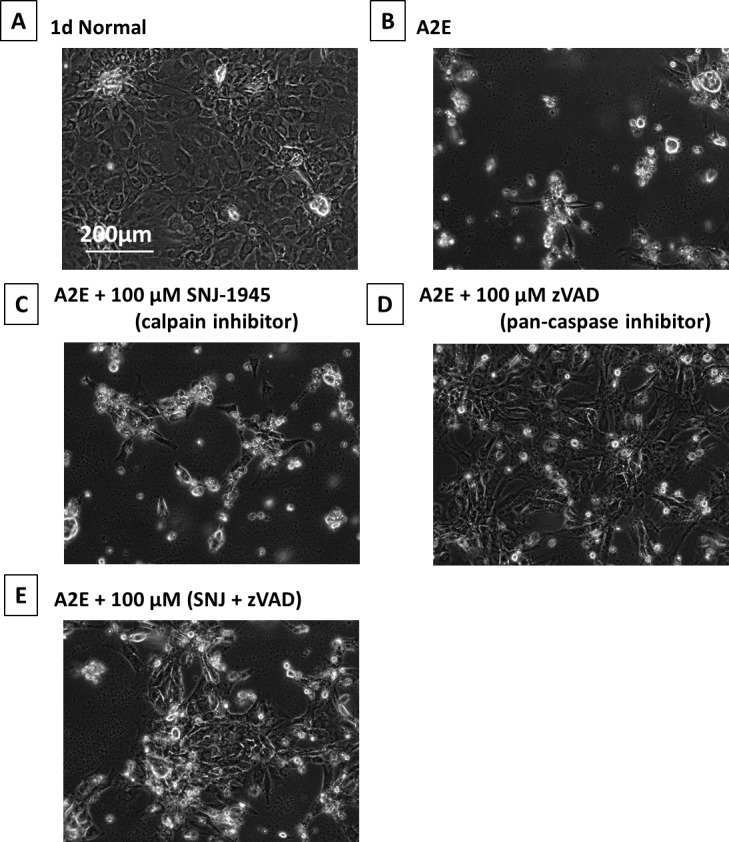
Methods: Monkey primary RPE cells were cultured under hypoxic conditions in a Gaspak pouch or cultured with synthetic A2E. Immunoblotting was used to detect activation of calpain and caspase. Calpain inhibitor, SNJ-1945, and pan-caspase inhibitor, z-VAD-fmk, were used to confirm activation of the proteases.
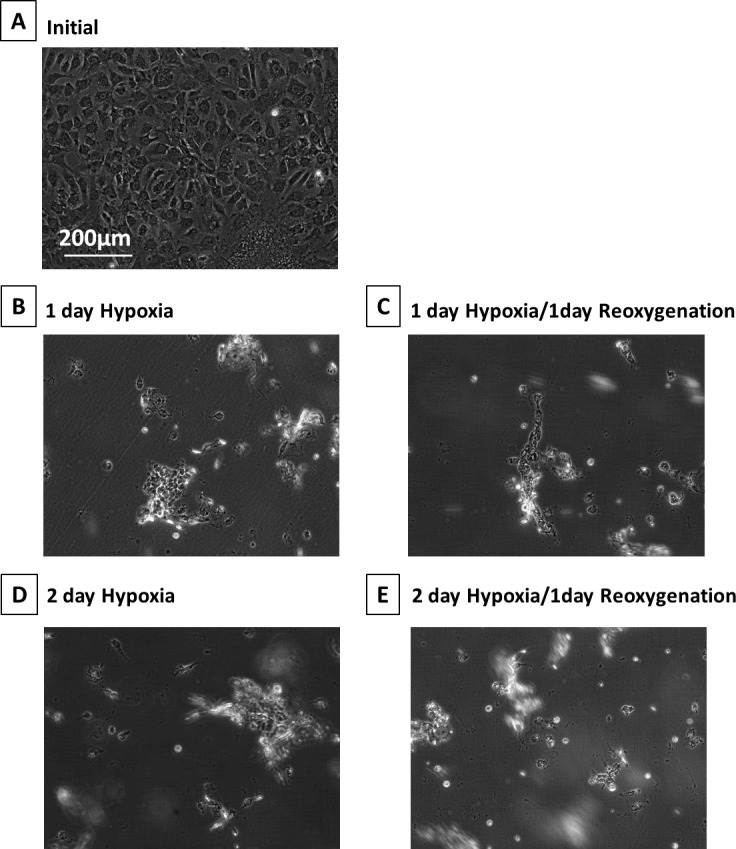
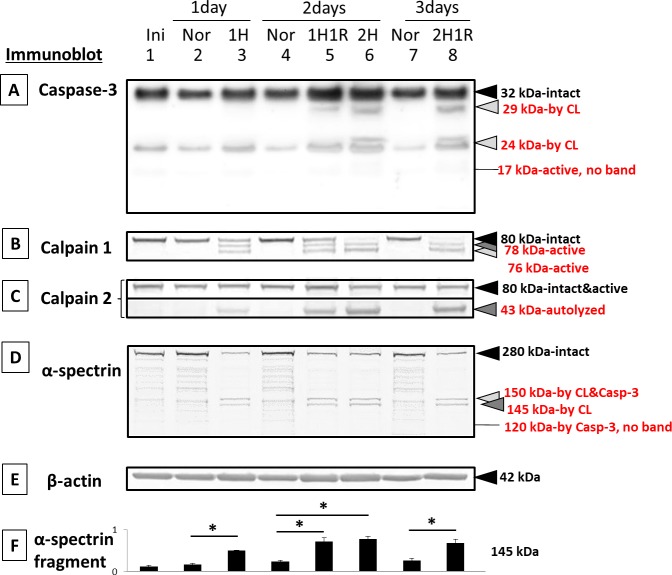
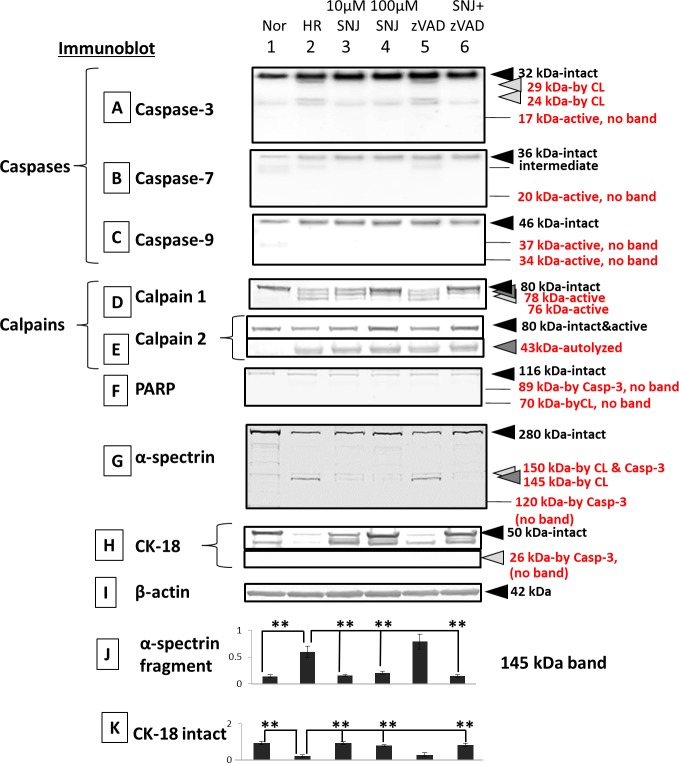
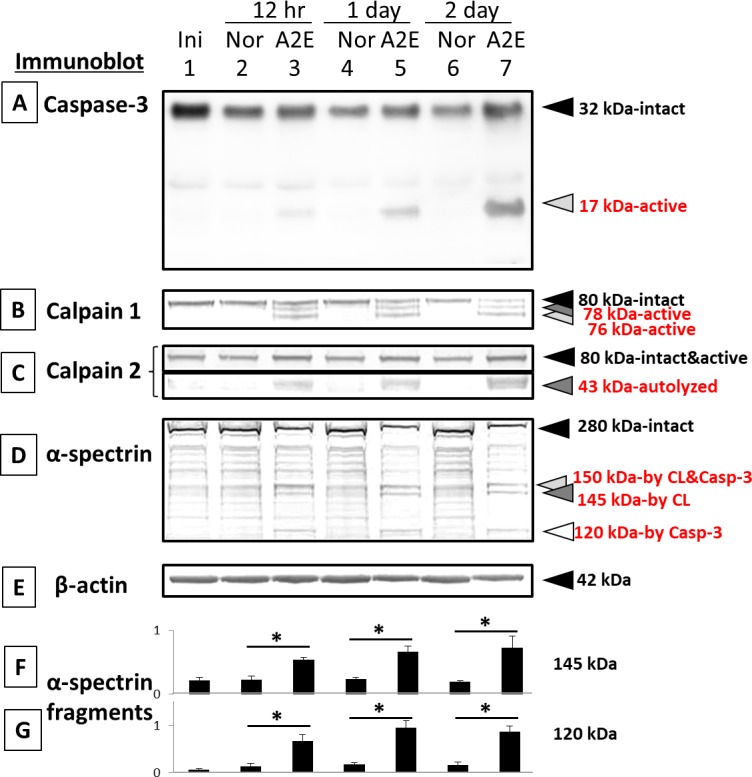
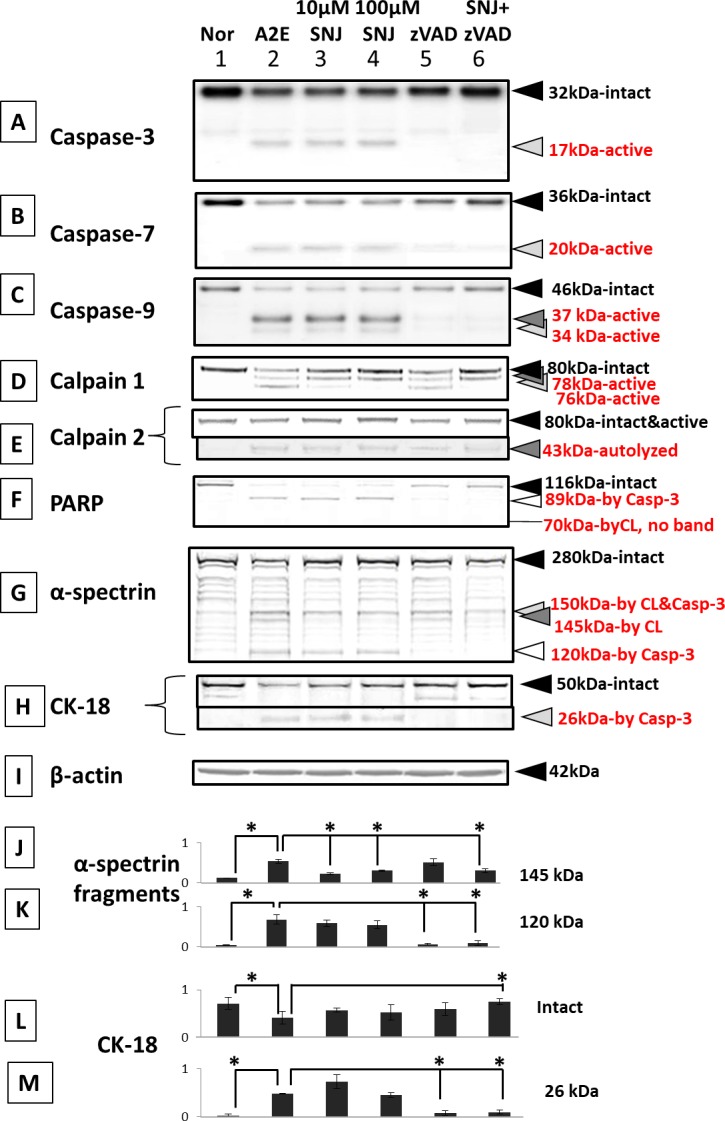
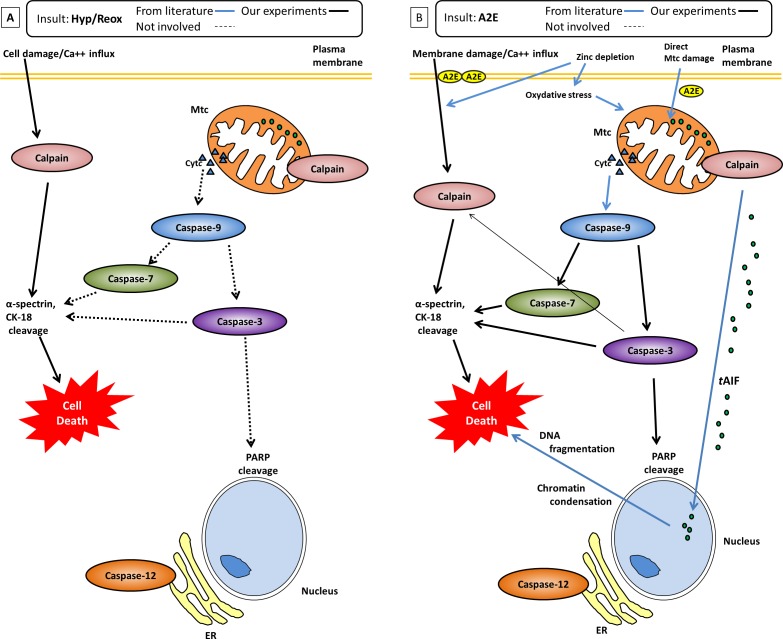
Results: (1) Hypoxia and A2E each decreased viability of RPE cells in a time-dependent manner. (2) Incubation under hypoxia alone induced activation of calpain, but not caspases. SNJ-1945 inhibited calpain activation, but z-VAD-fmk did not. (3) Incubation with A2E alone induced activation of calpain, caspase-9, and caspase-3. SNJ-1945 inhibited calpain activation. z-VAD-fmk inhibited caspase activation, suggesting no interaction between calpain and caspases.
Conclusions: Hypoxia activated the calpain pathway, while A2E activated both calpain and caspase pathways in monkey RPE cells. Such knowledge may be utilized in the treatment of AMD if inhibitor drugs against calpain and/or caspase are used to prevent RPE dysfunction caused by hypoxia or A2E.
Figures
Similar articles
-
Activation of the mitochondrial caspase pathway and subsequent calpain activation in monkey RPE cells cultured under zinc depletion.Eye (Lond). 2014 Jan;28(1):85-92. doi: 10.1038/eye.2013.239. Epub 2013 Nov 8. Eye (Lond). 2014. PMID: 24202052 Free PMC article.
-
Contribution of calpain to cellular damage in human retinal pigment epithelial cells cultured with zinc chelator.Curr Eye Res. 2007 Jun;32(6):565-73. doi: 10.1080/02713680701359633. Curr Eye Res. 2007. PMID: 17612972
-
Calpain, not caspase, is the causative protease for hypoxic damage in cultured monkey retinal cells.Invest Ophthalmol Vis Sci. 2011 Sep 1;52(10):7059-67. doi: 10.1167/iovs.11-7497. Invest Ophthalmol Vis Sci. 2011. PMID: 21757584 Free PMC article.
-
Calpain and caspase: can you tell the difference?Trends Neurosci. 2000 Jan;23(1):20-6. doi: 10.1016/s0166-2236(99)01479-4. Trends Neurosci. 2000. PMID: 10631785 Review.
-
The kinder side of killer proteases: caspase activation contributes to neuroprotection and CNS remodeling.Apoptosis. 2004 Mar;9(2):111-21. doi: 10.1023/B:APPT.0000018793.10779.dc. Apoptosis. 2004. PMID: 15004508 Free PMC article. Review.
Cited by
-
A simplified protocol to induce hypoxia in a standard incubator: A focus on retinal cells.Exp Eye Res. 2023 Nov;236:109653. doi: 10.1016/j.exer.2023.109653. Epub 2023 Oct 2. Exp Eye Res. 2023. PMID: 37793495 Free PMC article.
-
Calpains as mechanistic drivers and therapeutic targets for ocular disease.Trends Mol Med. 2022 Aug;28(8):644-661. doi: 10.1016/j.molmed.2022.05.007. Epub 2022 May 29. Trends Mol Med. 2022. PMID: 35641420 Free PMC article. Review.
-
Neuronal RBM5 modulates cell signaling responses to traumatic and hypoxic-ischemic injury in a sex-dependent manner.Cell Death Discov. 2023 Oct 17;9(1):379. doi: 10.1038/s41420-023-01677-7. Cell Death Discov. 2023. PMID: 37848418 Free PMC article.
-
Effects of Zinc on the Right Cardiovascular Circuit in Long-Term Hypobaric Hypoxia in Wistar Rats.Int J Mol Sci. 2023 May 31;24(11):9567. doi: 10.3390/ijms24119567. Int J Mol Sci. 2023. PMID: 37298516 Free PMC article.
-
Calpain-specific breakdown fragment in human drusen.Histol Histopathol. 2024 Feb;39(2):165-175. doi: 10.14670/HH-18-635. Epub 2023 Jun 1. Histol Histopathol. 2024. PMID: 37314158
References
-
- Arjamaa O, Nikinmaa M, Salminen A, Kaarniranta K. Regulatory role of HIF-1alpha in the pathogenesis of age-related macular degeneration (AMD) Ageing Res Rev. 2009;8:349–358. - PubMed
-
- Algvere PV, Seregard S. Drusen maculopathy: a risk factor for AMD. Can we prevent visual loss? Acta Ophthalmol Scand. 2003;81:427–429. - PubMed
-
- Ambati J, Ambati BK, Yoo SH, Ianchulev S, Adamis AP. Age-related macular degeneration: etiology, pathogenesis, and therapeutic strategies. Surv Ophthalmol. 2003;48:257–293. - PubMed
Publication types
MeSH terms
Substances
Grants and funding
LinkOut - more resources
Full Text Sources
Other Literature Sources
Research Materials
