. 2018 Feb:46:28-39.
doi: 10.1016/j.mri.2017.07.027. Epub 2017 Oct 17.

A novel DTI-QA tool: Automated metric extraction exploiting the sphericity of an agar filled phantom

Affiliations

A novel DTI-QA tool: Automated metric extraction exploiting the sphericity of an agar filled phantom

Sofia Chavez et al. Magn Reson Imaging. 2018 Feb.

Abstract

Purpose: To develop a quality assurance (QA) tool (acquisition guidelines and automated processing) for diffusion tensor imaging (DTI) data using a common agar-based phantom used for fMRI QA. The goal is to produce a comprehensive set of automated, sensitive and robust QA metrics.

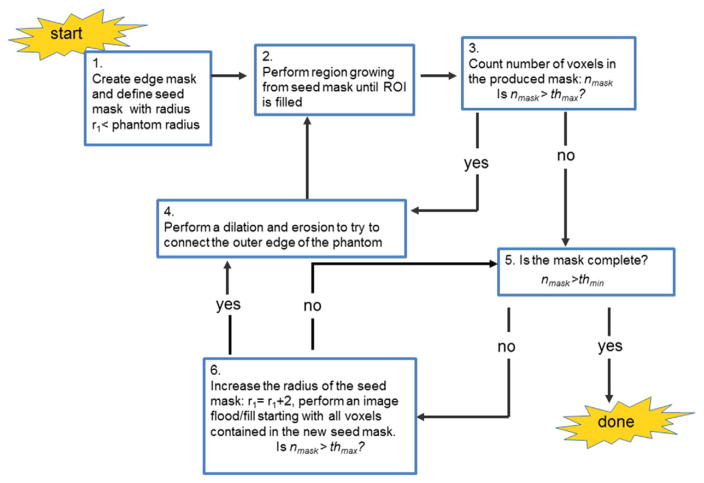
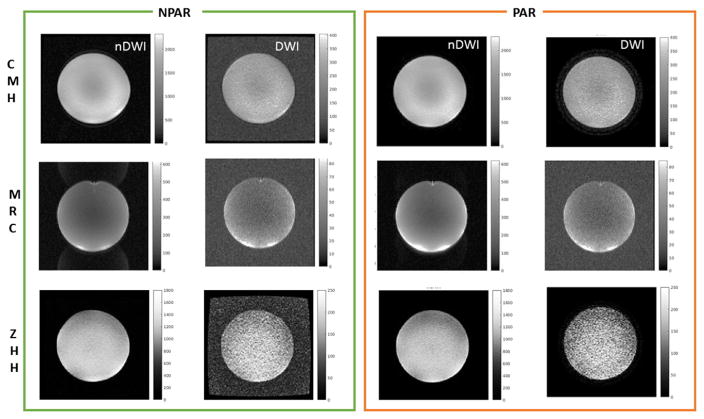
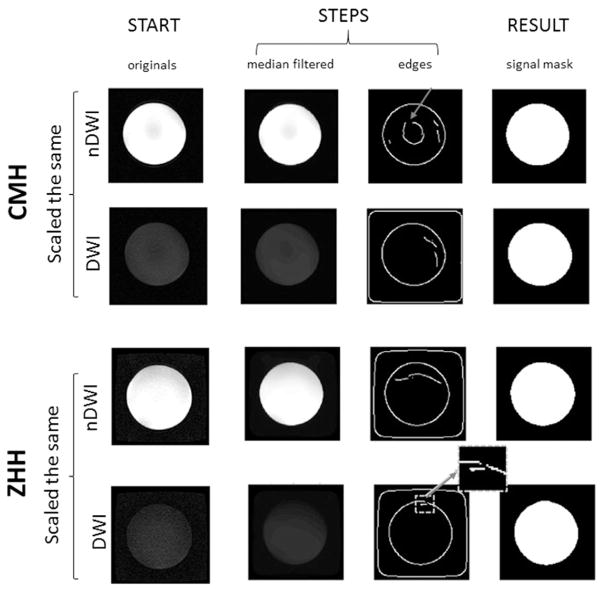
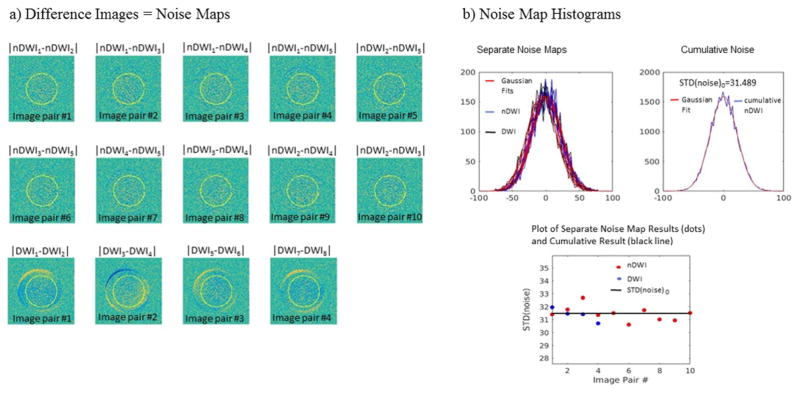
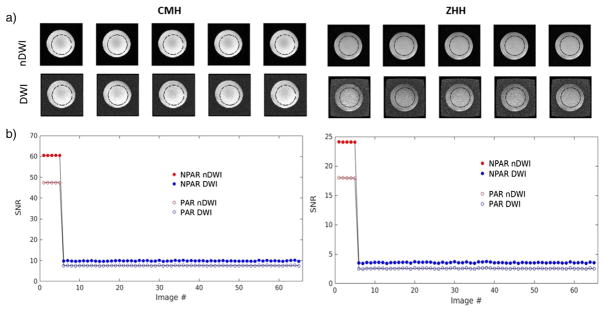
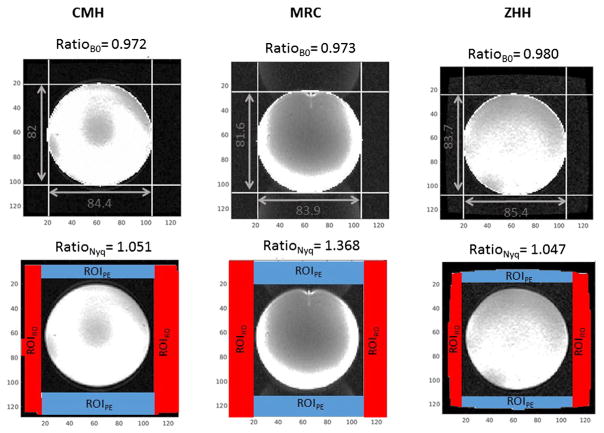
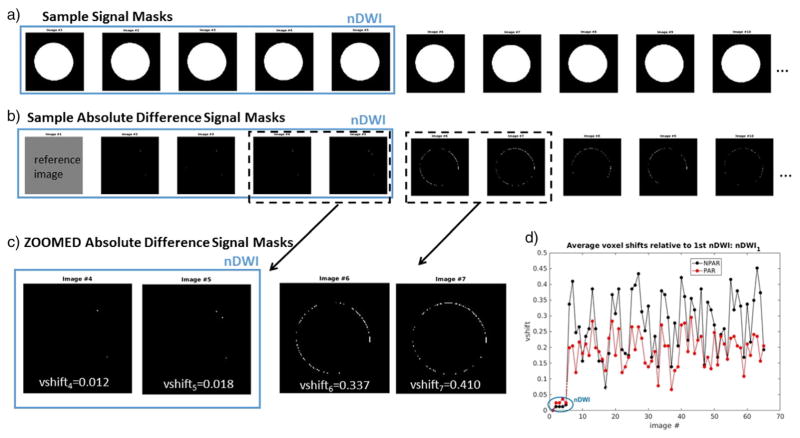
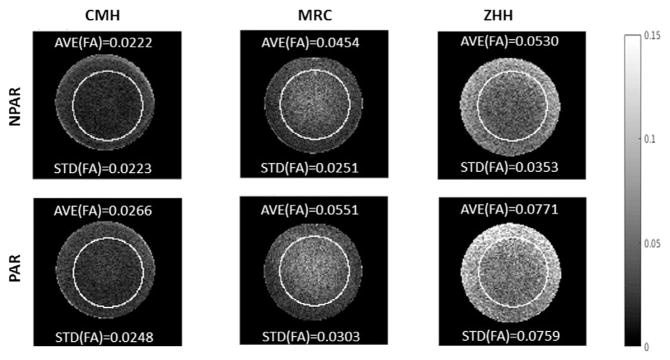
Methods: A readily available agar phantom was scanned with and without parallel imaging reconstruction. Other scanning parameters were matched to the human scans. A central slab made up of either a thick slice or an average of a few slices, was extracted and all processing was performed on that image. The proposed QA relies on the creation of two ROIs for processing: (i) a preset central circular region of interest (ccROI) and (ii) a signal mask for all images in the dataset. The ccROI enables computation of average signal for SNR calculations as well as average FA values. The production of the signal masks enables automated measurements of eddy current and B0 inhomogeneity induced distortions by exploiting the sphericity of the phantom. Also, the signal masks allow automated background localization to assess levels of Nyquist ghosting.

Results: The proposed DTI-QA was shown to produce eleven metrics which are robust yet sensitive to image quality changes within site and differences across sites. It can be performed in a reasonable amount of scan time (~15min) and the code for automated processing has been made publicly available.

Conclusions: A novel DTI-QA tool has been proposed. It has been applied successfully on data from several scanners/platforms. The novelty lies in the exploitation of the sphericity of the phantom for distortion measurements. Other novel contributions are: the computation of an SNR value per gradient direction for the diffusion weighted images (DWIs) and an SNR value per non-DWI, an automated background detection for the Nyquist ghosting measurement and an error metric reflecting the contribution of EPI instability to the eddy current induced shape changes observed for DWIs.

Keywords: DTI; Distortions; Eddy currents; Phantom; QA; SNR.


Figures

Fig. 1
Fig. 1
Mask making algorithm flowchart. The main steps for the mask making algorithm are given. There are three steps that require a yes/no response to decide how to proceed. Steps 3 to 4 represent the iterative process for closing the outer edge of the phantom. Steps 5 to 6 represent the iterative process for filling the mask. The first step requires a selection of a radius r1 such that it is much smaller than the radius of the phantom (r1 = 30 voxels as per ccROI). The threshold values, thmin and thmax, consist of minimum and maximum expected number of voxels in the mask (see text to compute these). The number of voxels in the mask, nmask, is computed at Steps 3 and 6.
Fig. 2
Fig. 2
Sample Images used for DTI-QA metrics calculations across sites and across NPAR/PAR. Each row shows representative data for one of the SPINS sites. Representative images (nDWI and DWI) without PAR (NPAR) and with PAR are shown on the left and right, respectively. The nDWIs are scaled the same across NPAR/PAR, the same is true for the DWIs (but scales for nDWI and DWIs are different). The change in background is apparent for the GE sites: CMH and ZHH (top and bottom rows).
Fig. 3
Fig. 3
Signal mask making examples. Intermediate steps of the mask making algorithm are shown for two cases, different sites, across nDWI and DWI images (all are NPAR scans here). Here, the nDWIs and DWIs are scaled the same within site to emphasize the SNR challenge presented by the DWIs. The ‘edges’ step shows all the edges found on the first pass; image frame (zero-values border) differences are apparent across sites and nDWI/DWI. The top row (CMH-nDWI) shows an example where a central loop edge is found. Although it is not closed, it demonstrates how it could happen. The bottom row shows an example where the outer phantom edge is incomplete at the first pass. A single application of Step 4 was sufficient to close it in this case.
Fig. 4
Fig. 4
Calculation of STD(noise) for SNR measurements. a) Sample noise map images resulting from taking image differences: subtracting all possible nDWI pairs (top and central row) and also subtracting the first four pairs of DWIs (bottom row). Some gradation of signal is apparent in the DWIs noise maps that is not there for the nDWIs noise maps. b) Noise map histograms resulting for each noise map in a), as well as the cumulative noise histogram that results when all nDWI noise maps are combined. Gaussian fits are show over each histogram to demonstrate the Gaussian nature of the noise when computed in this manner. STD(noise) resulting from the Gaussian fits are plotted for each nDWIs and DWI pair shown in a), as well as for the cumulative nDWI noise histogram which we propose to use for all SNR calculations.
Fig. 5
Fig. 5
SNR results. Sample images are shown along with SNR plots across nDWIs and DWIs, for two sites. Plots show NPAR and PAR results overlaid for comparison. The images in a) show sample images (nDWI and DWIs) for the NPAR case with the position of the ccROI used to compute average signal for SNR computations; this ROI enables the exclusion of edge effects. The increased stability of SNRDWI and overall decrease in SNR with PAR is apparent in the plots in b).
Fig. 6
Fig. 6
B0 distortion and Nyquist ghost results. Sample nDWIs are shown for all three sites of the SPINS study (one in each column). The top row indicates the B0 distortion results per image, with measurements overlaid on images which are scaled to emphasize the background; the Nyquist ghosting of MRC is evident. The bottom row indicates the Nyquist ghosting metric results per image, while demonstrating the localization of the automated background ROIs used to compute RatioNyq.
Fig. 7
Fig. 7
Eddy current distortion measurements. a) Sample signal masks are shown for nDWIs and DWIs along the top row at a given site (CMH-NPAR). b) Difference signal masks resulting when the first nDWI signal mask is used as a reference. c) Zoomed difference signal masks are shown for two nDWIs and two DWIs along with the corresponding vshift value; it is evident that this value captures the amount of shape difference well. d) Plots of vshift values resulting for all images in the dataset (nDWI and DWI). Here, NPAR and PAR results are overlaid for comparison. It is obvious that for this case, the EPI-based instability, given by the shifts across nDWIs, is much less significant than the eddy current induced shifts which exclusively affect the DWIs. Furthermore, it is evident that PAR reduces the amount of shift present in the DWIs (i.e., the eddy current shift) while increasing it slightly for the nDWIs (i.e., the EPI-based instability).
Fig. 8
Fig. 8
FA results. Sample FA maps are shown (with ccROI overlaid) across sites, for NPAR and PAR. It is clear that FA is not constant throughout the homogeneous phantom, in particular around edges, but the amount of variation is site-dependent. Also, PAR tends to increase the FA in all cases. AVE(FA) and STD(FA) values are given along with each image to demonstrate how well the metric reflects the observable data quality.

References

    1. Pierpaoli C, Walker L, Irfanoglu MO, Barnett A, Basser P, Chang L-C, et al. TORTOISE: an integrated software package for processing of diffusion MRI data. Proceedings of the 18th ISMRM; 2010; Honolulu, USA. p. 1597.
    1. Jiang H, van Zijl PC, Kim J, Pearlson GD, Mori S. DtiStudio: resource program for diffusion tensor computation and fiber bundle tracking. Comput Methods Programs Biomed. 2006;81:106–16. - PubMed
    1. Liu Z, Wang Y, Gerig G, Gouttard S, Tao R, Fletcher T, et al. Quality control of diffusion weighted images. Proceedings of SPIE 7628, medical imaging 2010: advanced PACS-based imaging informatics and therapeutic applications; 2010; San Diego, USA. - PMC - PubMed
    1. Andersson J, Sotiropoulos S. An integrated approach to correction for off-resonance effects and subject movement in diffusion MR imaging. NeuorImage. 2016;125:1063–78. - PMC - PubMed
    1. Jenkinson M, Beckmann CF, Behrens TE, Woolrich MW, Smith SM. FSL. Neuroimage. 2012;62:782–90. - PubMed

MeSH terms

LinkOut - more resources