. 2017 Dec 15;292(50):20394-20409.
doi: 10.1074/jbc.M117.806018. Epub 2017 Oct 20.

The C-terminal region of A-kinase anchor protein 350 (AKAP350A) enables formation of microtubule-nucleation centers and interacts with pericentriolar proteins

Affiliations

The C-terminal region of A-kinase anchor protein 350 (AKAP350A) enables formation of microtubule-nucleation centers and interacts with pericentriolar proteins

Elena Kolobova et al. J Biol Chem. .

Abstract

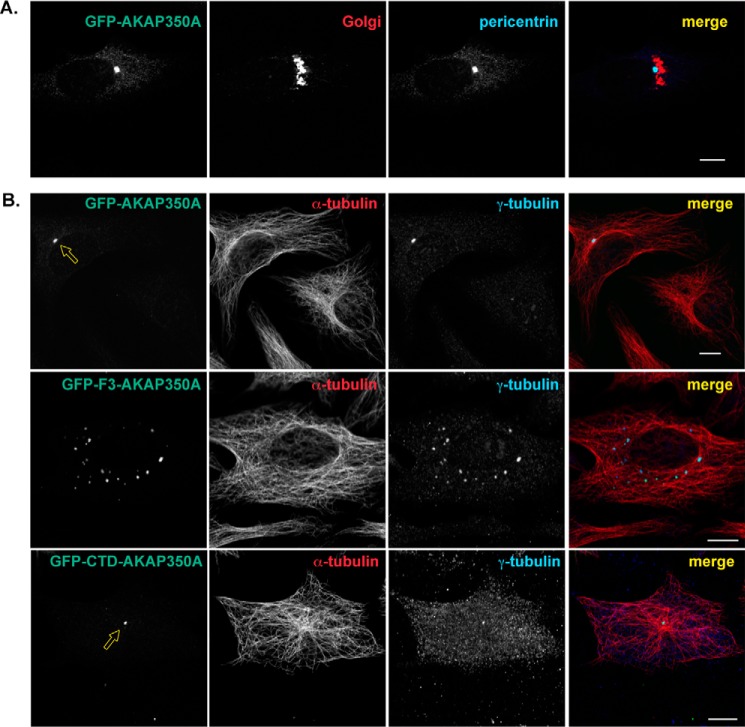
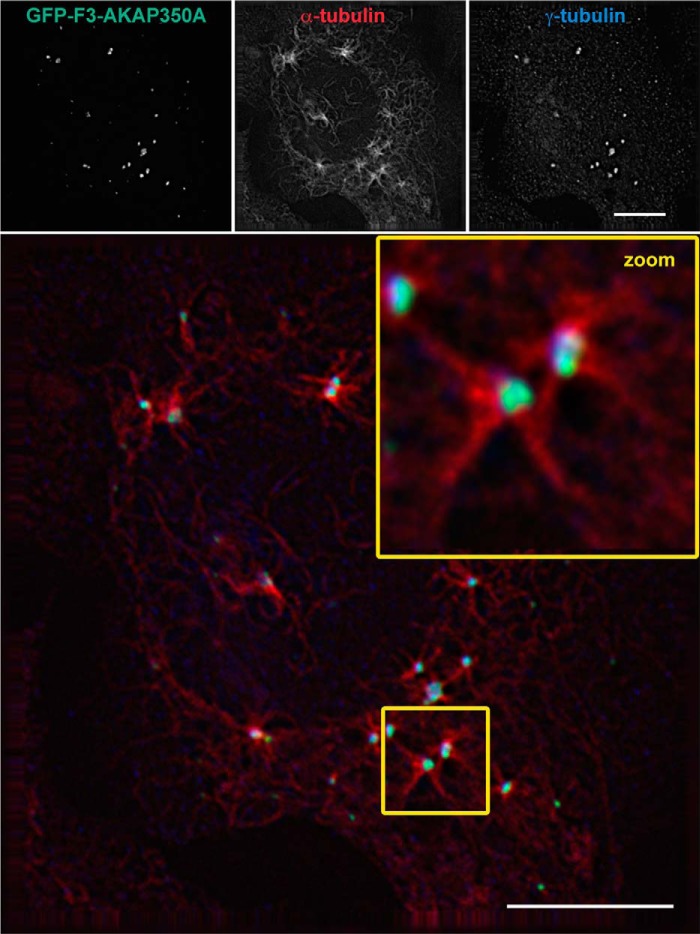
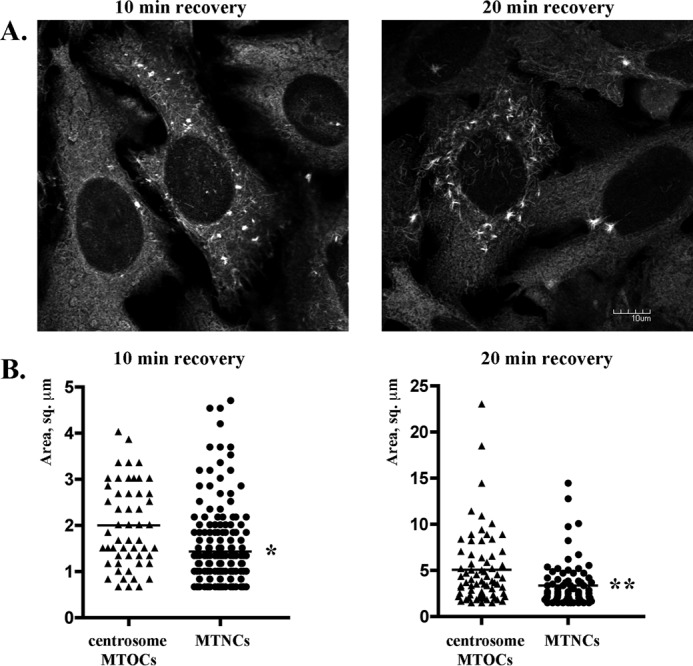
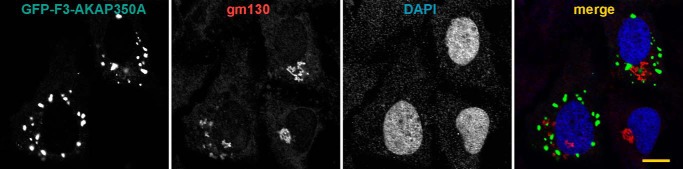
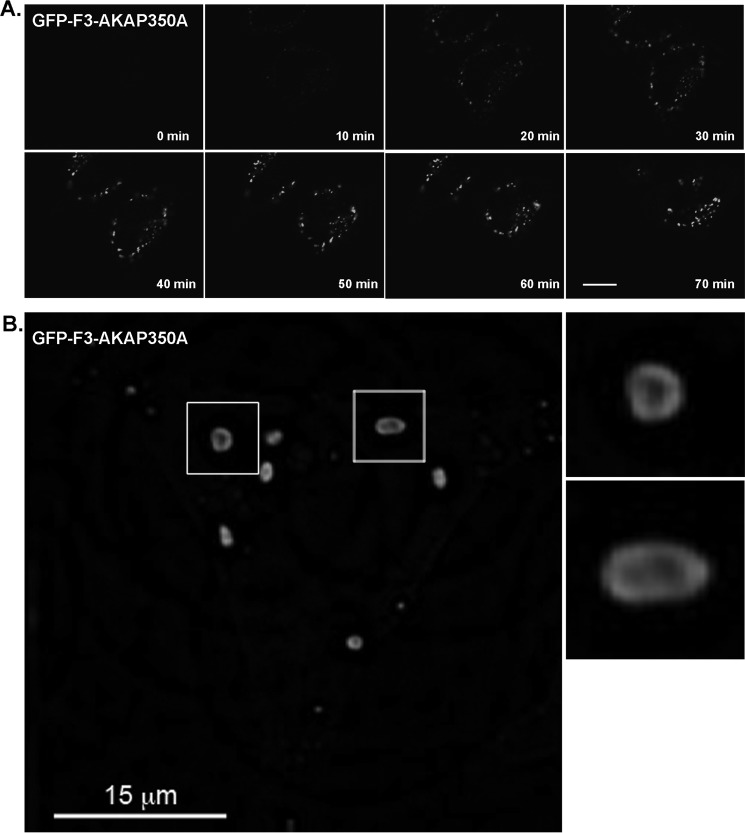
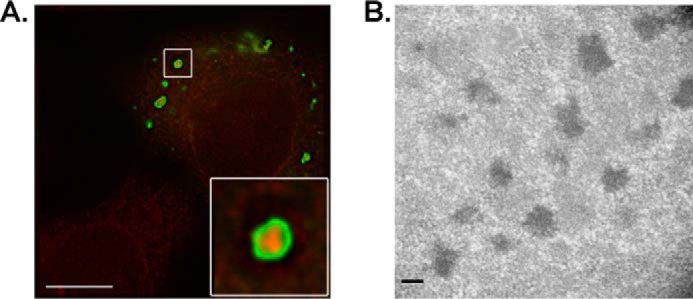
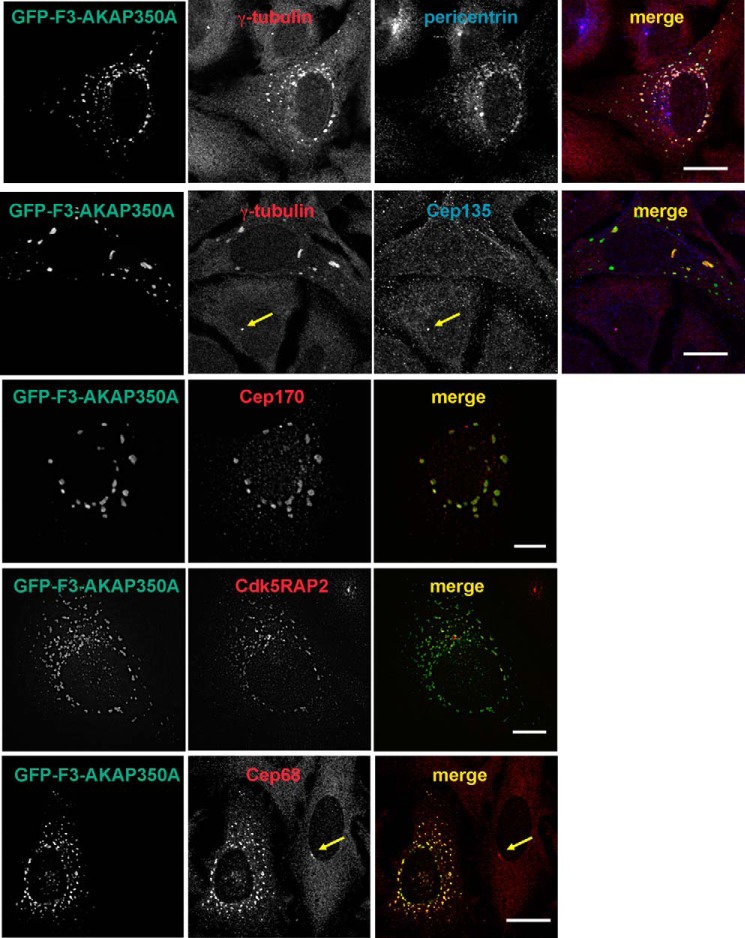
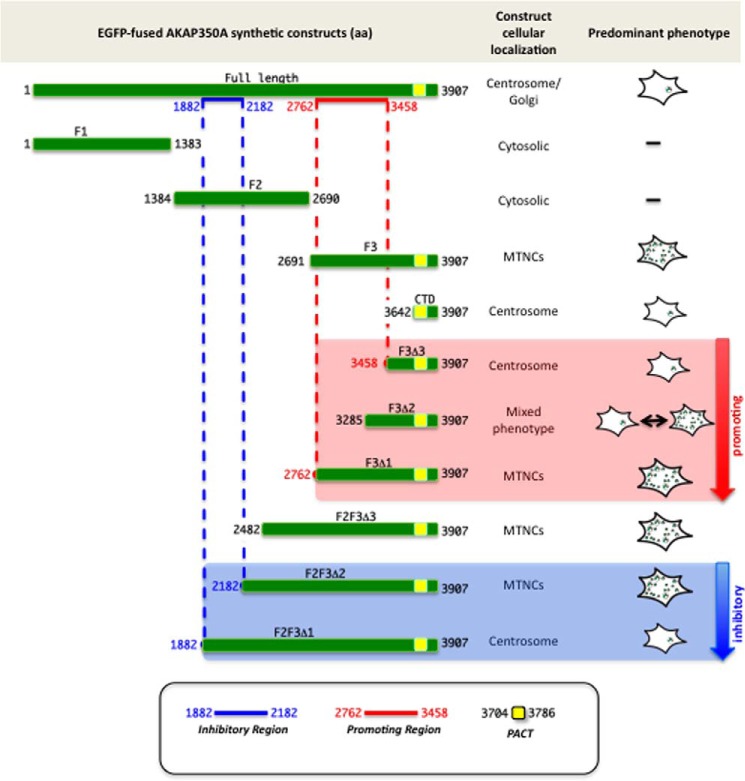
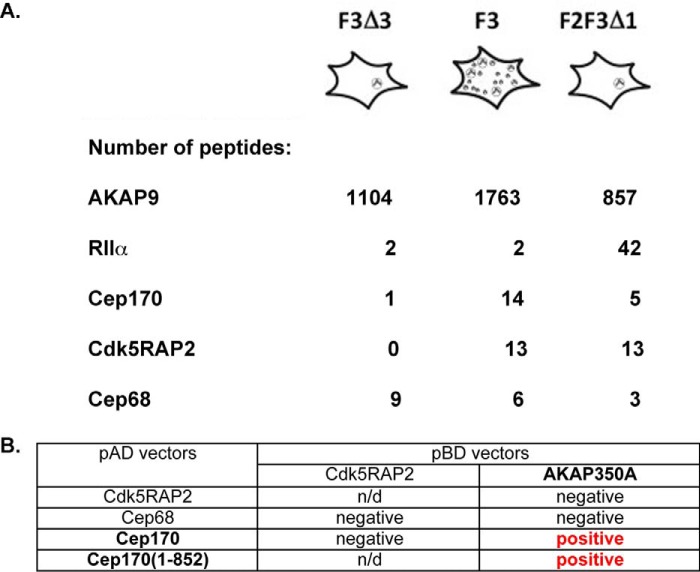
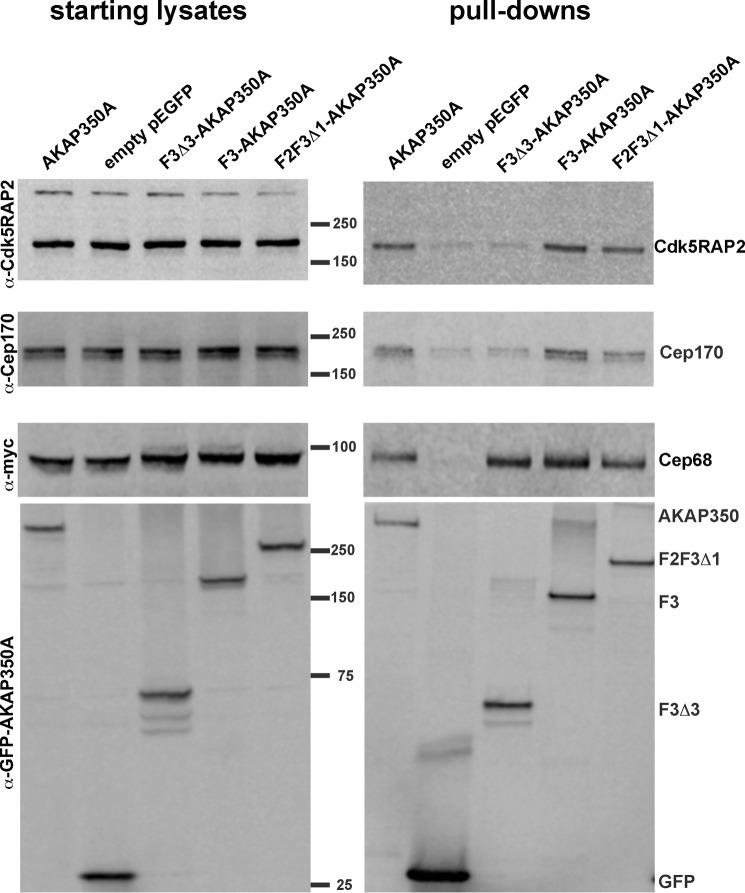
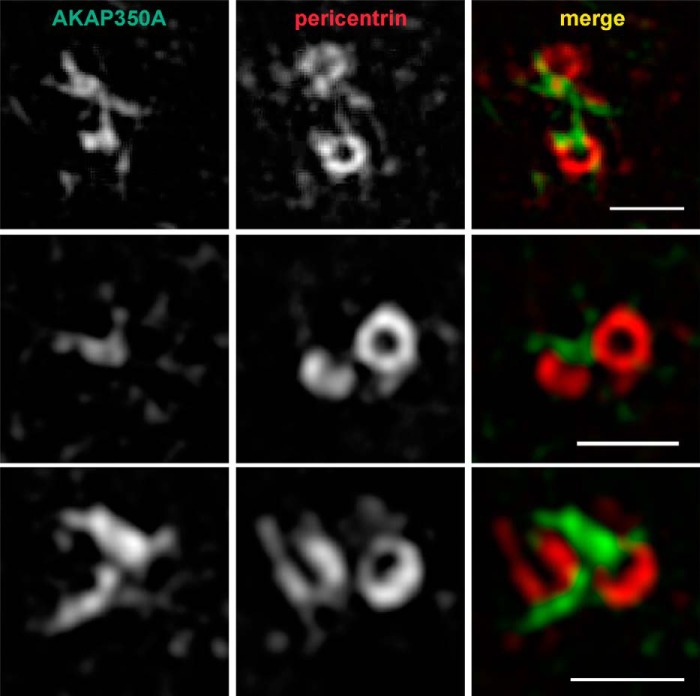
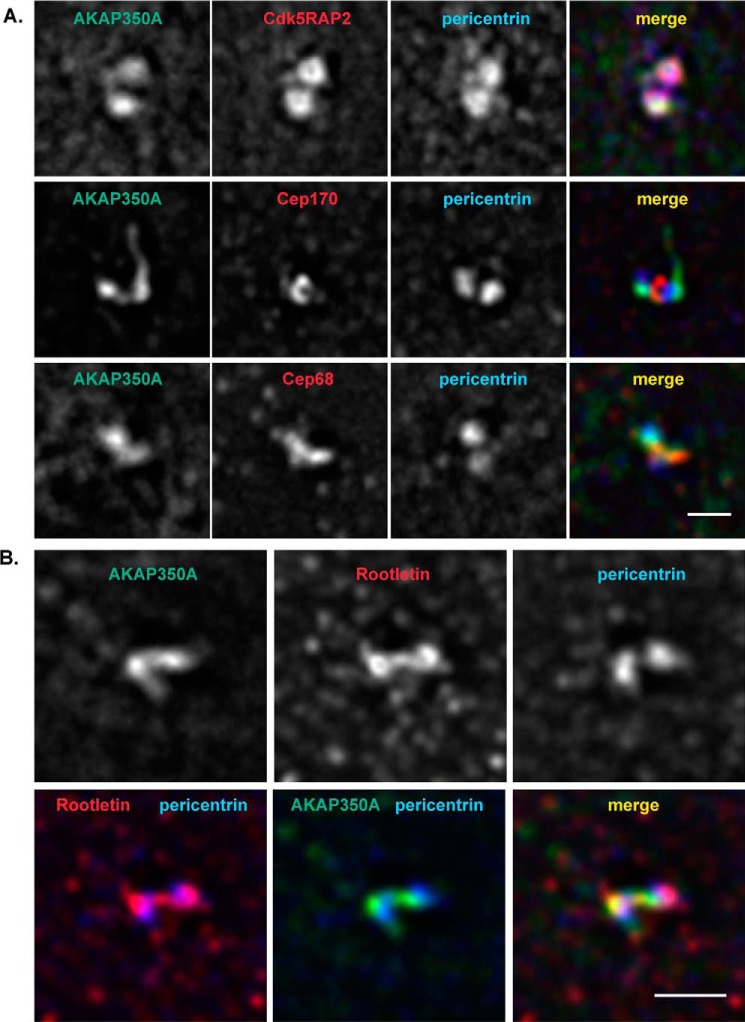
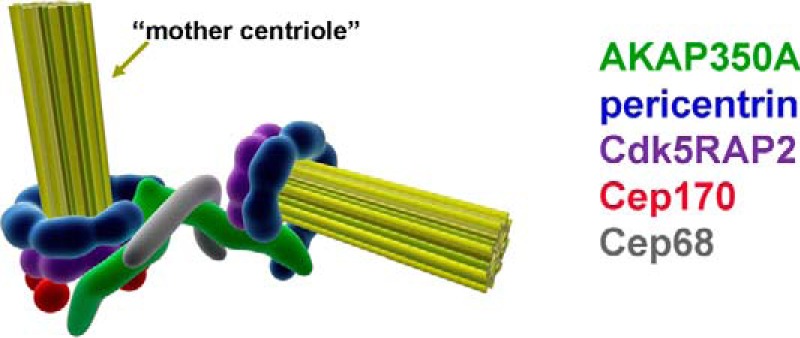
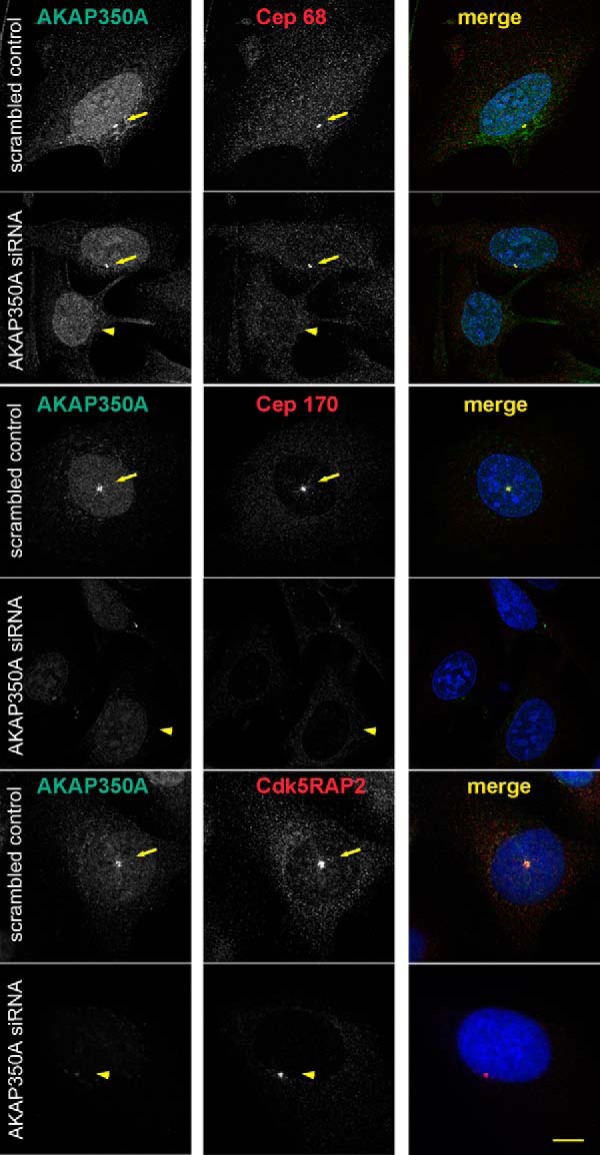
Microtubules in animal cells assemble (nucleate) from both the centrosome and the cis-Golgi cisternae. A-kinase anchor protein 350 kDa (AKAP350A, also called AKAP450/CG-NAP/AKAP9) is a large scaffolding protein located at both the centrosome and Golgi apparatus. Previous findings have suggested that AKAP350 is important for microtubule dynamics at both locations, but how this scaffolding protein assembles microtubule nucleation machinery is unclear. Here, we found that overexpression of the C-terminal third of AKAP350A, enhanced GFP-AKAP350A(2691-3907), induces the formation of multiple microtubule-nucleation centers (MTNCs). Nevertheless, these induced MTNCs lacked "true" centriole proteins, such as Cep135. Mapping analysis with AKAP350A truncations demonstrated that AKAP350A contains discrete regions responsible for promoting or inhibiting the formation of multiple MTNCs. Moreover, GFP-AKAP350A(2691-3907) recruited several pericentriolar proteins to MTNCs, including γ-tubulin, pericentrin, Cep68, Cep170, and Cdk5RAP2. Proteomic analysis indicated that Cdk5RAP2 and Cep170 both interact with the microtubule nucleation-promoting region of AKAP350A, whereas Cep68 interacts with the distal C-terminal AKAP350A region. Yeast two-hybrid assays established a direct interaction of Cep170 with AKAP350A. Super-resolution and deconvolution microscopy analyses were performed to define the association of AKAP350A with centrosomes, and these studies disclosed that AKAP350A spans the bridge between centrioles, co-localizing with rootletin and Cep68 in the linker region. siRNA-mediated depletion of AKAP350A caused displacement of both Cep68 and Cep170 from the centrosome. These results suggest that AKAP350A acts as a scaffold for factors involved in microtubule nucleation at the centrosome and coordinates the assembly of protein complexes associating with the intercentriolar bridge.

Keywords: A-kinase anchoring protein (AKAP); AKAP450; AKAP9; Cdk5RAP2; Cep170; Cep68; centrosome; microscopy; microtubule; protein kinase A (PKA).


Conflict of interest statement

The authors declare that they have no conflicts of interest with the contents of this article

Figures

Figure 1.
Figure 1.
Distribution of overexpressed AKAP350A constructs. A, EGFP-AKAP350A was expressed in HeLa cells, which were stained with antibodies against the cis-Golgi protein gm130 (red) and the centrosome protein pericentrin (blue). Synthetic full-length AKAP350A was strongly accumulated at the centrosomes, with less apparent accumulation at the Golgi apparatus. B, HeLa cells expressing EGFP chimeras were fixed with methanol and stained for α-tubulin (red) and γ-tubulin (blue). Open arrows indicate single centrosomes. Overexpression of EGFP-F3-AKAP350A(2691–3907) but not EGFP-AKAP350A or EGFP-CTD-AKAP350A(3642–3907) induced formation of multiple γ-tubulin-containing units. Bar, 10 μm.
Figure 2.
Figure 2.
Induction of γ-tubulin-containing units caused by overexpression of EGFP-F3-AKAP350A are functional MTNCs. HeLa cells transfected with EGFP-F3-AKAP350A were treated with 33 μm nocodazole for 2 h at 37 °C to depolymerize microtubules, washed with DMEM, and allowed to recover for 30 min to initiate microtubule recovery, fixed in methanol, and stained for α-tubulin (red) and γ-tubulin (blue). Formation of microtubules asters originated from numerous γ-tubulin-containing units during recovery after nocodazole treatment. Bar, 10 μm.
Figure 3.
Figure 3.
Comparison of centrosome MTOCs with EGFP-F3-AKAP350A-induced MTNCs. A, HeLa cells transfected with EGFP-F3-AKAP350A were treated with 33 μm nocodazole for 2 h at 37 °C to depolymerize microtubules, washed with DMEM, and allowed to recover for 10 or 20 min to initiate microtubule recovery, fixed in methanol, and stained for α-tubulin. Bar, 10 μm. B, formation of microtubules asters was quantified using ImageJ particle analysis. After 10 min of nocodazole recovery, the average size of asters originating from centrosome MTOCs sizes was 2.00 ± 0.90 μm2 (n = 54) versus 1.43 ± 0.85 μm2 for induced MTNCs (n = 177) (*, p = 0.0001); after 20 min of nocodazole recovery, the average centrosome MTOC aster size was 5.08 ± 3.9 μm2 (n = 71) versus 3.36 ± 2.43 μm2 for induced MTNCs (n = 79) (**, p = 0.0019). (Data are presented as average ± S.D.).
Figure 4.
Figure 4.
MTNCs induced by overexpression of EGFP-F3-AKAP350A are not Golgi-associated. HeLa cells transfected with EGFP-F3-AKAP350A were fixed with methanol and stained for the cis-Golgi marker gm130 (red) and DAPI (blue). Golgi cisternae were not associated with EGFP-F3-AKAP350A-expressing MTNCs. Bar, 10 μm.
Figure 5.
Figure 5.
Visualization in live cells of MTNC formation induced by overexpression of EGFP-F3-AKAP350A. A, de novo formation of MTNCs induced by overexpression of EGFP-F3-AKAP350A. Video was initiated 6 h following transfection and recorded for 80 min. Snapshots from video were taken every 10 min using a Nikon A1R confocal microscope (see supplemental video S1). B, “donut-shaped” MTNCs induced by overexpression of EGFP-F3-AKAP350A. A snapshot from live imaging of GFP-F3-AKAP350A shows the presence of rings around MTNCs. The video was started 20 h after transfection and recorded for 2 h every 2 min using a DeltaVision deconvolution microscope (see supplemental Video S2). Bar, 15 μm.
Figure 6.
Figure 6.
Structural assessment of MTNCs induced by overexpression of EGFP-F3-AKAP350A. A, DeltaVision deconvolution microscopy of MTNCs. Donut-shaped MTNCs induced by overexpression of EGFP-F3-AKAP350A include γ-tubulin (red) in the center hollow space. Bar, 15 μm. B, transmission electron microscopy of MTNCs. HeLa cells overexpressing EGFP-F3-AKAP350A were fixed, embedded, and processed for imaging with transmission electron microscopy. Bar, 100 nm.
Figure 7.
Figure 7.
Endogenous γ-tubulin, pericentrin, Cep68, Cep170, and Cdk5RAP2 but not Cep135 co-localized with overexpressed of EGFP-F3-AKAP350A on MTNCs. HeLa cells were fixed with methanol or with 4% PFA for Cdk5RAP2 staining and immunostained for endogenous γ-tubulin (red), pericentrin. or Cep135 (blue), Cdk5RAP2, Cep170, Cep68 (red). (Arrows indicate non-transfected cells with a single centrosome.) The degree of co-localization between AKAP350A (green) and γ-tubulin/Cep170/Cdk5RAP2/Cep68 (red) or between AKAP350A (green) and pericentrin (blue) were quantified using PCC. PCCs were determined using JACOP plug-in of ImageJ software. PCC: γ-tubulin:AKAP350A 0.97 ± 0.06; pericentrin:AKAP350A 0.95 ± 0.11; Cep170:AKAP350A 0.96 ± 0.08; Cdk5RAP:AKAP350A 0.95 ± 0.09; Cep68:AKAP350A 0.98 ± 0.03). Bar, 15 μm.
Figure 8.
Figure 8.
Mapping of AKAP350 regions responsible for the formation of supernumerary MTNCs. Schematic representation of full-length and truncations of synthetic EGFP-AKAP350A. Note the change of phenotype from single centrosome to multiple MTNCs with addition of promoting region (amino acids 2762–3458) and a change back to a single centrosome-targeted phenotype with the inhibitory region (amino acids 1882–2182). PACT, pericentrin-AKAP450 centrosomal targeting domain (amino acids 3704–3786). Quantification of predominant phenotype was performed for each EGFP-AKAP350A truncation using at least 100 cells overexpressing evaluated mutant; values are presented as percentage of cells with predominant phenotype (single centrosome or multiple MTNCs) from total number of cells expressing evaluated EGFP-AKAP350A. Data presented as average ± S.D. Full-length AKAP350 (centrosome 100 ± 0%), F2F3Δ1 (centrosome; 81 ± 9%), F2F3Δ2 (MTNCs; 82 ± 15%), F2F3Δ3 (MTNCs; 87 ± 7%), F3 (MTNCs; 92 ± 6%), F3Δ1 (MTNCs; 93 ± 4%), F3Δ2 (mixed phenotype; 54 ± 16% of MTNCs), F3Δ3 (centrosome; 93 ± 2%).
Figure 9.
Figure 9.
Analysis of proteins interacting with AKAP350A. A, spectral counts of peptides specifically isolated with GFP-chimeric AKAP350A truncation mutants. GFP-tagged truncation mutants of AKAP350A exhibiting different phenotypes were overexpressed in HEK cells, isolated with GFP-binding protein beads, and analyzed by MudPIT. B, yeast two-hybrid interactions. Yeast two-hybrid assays were performed with plasmids encoding the DNA-binding domain of GAL4 fused to AKAP350A or Cdk5RAP2 versus the activation domain of GAL4 fused to Cep68, Cep170, or Cdk5RAP2. Positive and negative colonies were identified as described under “Experimental procedures.” Note that because of self-activation, the interaction between Cep68 and Cep170 was not tested using two-hybrid assays.
Figure 10.
Figure 10.
AKAP350A association with Cdk5RAP2, Cep170, and Cep68 proteins. EGFP-tagged AKAP350A constructs including full-length AKAP350A, empty pEGFP-C1, F3D3-AKAP350A, F3-AKAP350A, or F2F3D1-AKAP350A vectors were expressed in HEK-293T cells or co-expressed with Myc-tagged Cep68. Proteins isolated using GFP-binding protein conjugated beads were probed either for endogenous Cdk5RAP2 and Cep170 or for Myc tag (to detect Cep68) and for GFP (to detect AKAP350A). Empty pEGFP-C1 vector was used as a negative control. Dual detection was performed on the same membrane for both GFP and Cdk5RAP2/Cep170 or GFP and Myc tag using Odyssey LiCor system. Results are representative of three independent experiments.
Figure 11.
Figure 11.
AKAP350A resides within linker connecting centrioles. HeLa cells were fixed with cold methanol and stained for endogenous AKAP350A (green) and pericentrin (red). Images were taken using 3D-SIM super-resolution fluorescence microscopy (OMX Blaze). Note the distribution of AKAP350A between the centrioles. Bar, 1 μm.
Figure 12.
Figure 12.
AKAP350A, together with Cep68, spans the linker connecting centrioles. A, HeLa cells were fixed with cold methanol or 4% PFA for Cdk5RAP2 staining and stained for AKAP350A (green) and Cdk5RAP2, Cep170, or Cep68 (red) and pericentrin (blue). Images were taken using DeltaVision deconvolution fluorescence microscopy. Bar 1, μm (applies to all images). B, HeLa cells were fixed with cold methanol and stained for AKAP350A (green), rootletin (red), and pericentrin (blue). Images were taken using DeltaVision deconvolution fluorescence microscopy. Bar, 1 μm (applies to all images).
Figure 13.
Figure 13.
Schematic representation of the assembly of proteins in the centrioles and the bridge connecting two centrioles. Both pericentrin and Cdk5RAP2 form ring-like structures around the bases of both centrioles. In contrast, Cep170 is only associated with mother centriole. AKAP350A is observed in the bridge between centrioles as well as adjacent to the staining for Cep170 at the mother centriole. Cep68 appeared to distribute along AKAP350A staining in the intercentriolar bridge region.
Figure 14.
Figure 14.
Depletion of AKAP350A by siRNA interference. U2OS cells were transfected with either non-specific scrambled RNA duplexes or siRNA duplexes specific for AKAP350A, fixed, and dual-stained for AKAP350A (green in merged images) and Cep68, Cep170, or Cdk5RAP2 (red in merged images). Arrows indicate cells with AKAP350A at centrosomes. Arrowheads indicate cells with loss of AKAP350A. Depletion of AKAP350A caused loss of both Cep68 and Cep170 from the centrosome, but Cdk5RAP2 localization at the centrosome was not affected. Bar, 10 μm (applies to all images).

Similar articles

Cited by

References

    1. Alvey P. L. (1985) An investigation of the centriole cycle using 3T3 and CHO cells. J. Cell Sci. 78, 147–162 - PubMed
    1. Kuriyama R., and Borisy G. G. (1981) Centriole cycle in Chinese hamster ovary cells as determined by whole-mount electron microscopy. J. Cell Biol. 91, 814–821 - PMC - PubMed
    1. Vorobjev I. A., and Chentsov YuS. (1982) Centrioles in the cell cycle. I. Epithelial cells. J. Cell Biol. 93, 938–949 - PMC - PubMed
    1. Bornens M. (2012) The centrosome in cells and organisms. Science 335, 422–426 - PubMed
    1. Nigg E. A., and Stearns T. (2011) The centrosome cycle: centriole biogenesis, duplication and inherent asymmetries. Nat. Cell Biol. 13, 1154–1160 - PMC - PubMed

MeSH terms